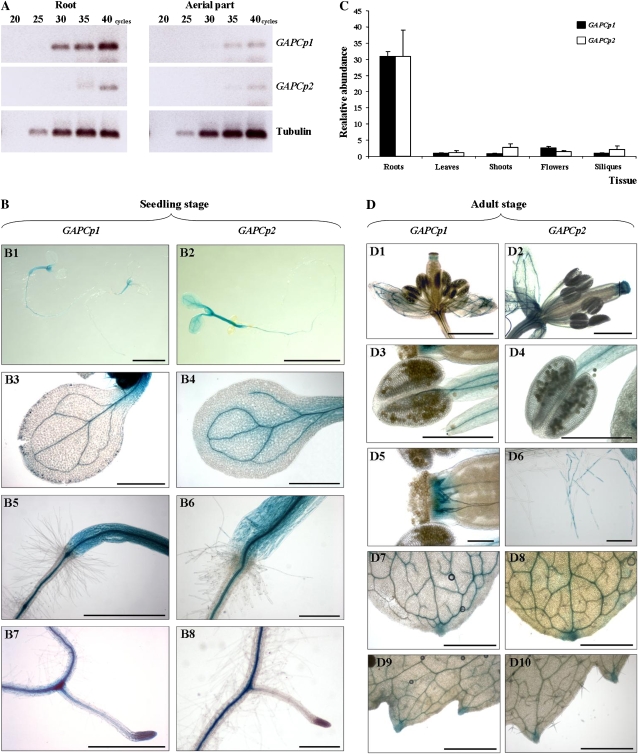
Figure 4.
Expression analysis of GAPCp1 and GAPCp2 genes. A, RT-PCR analysis of GAPCp1 and GAPCp2 in the aerial part and roots of 17-d-old seedlings. B, Expression of GUS under the control of GAPCp1 and GAPCp2 promoters in seedlings (B1 and B2), cotyledons (B3 and B4), shoots (B5 and B6), and roots (B7 and B8) of 6- to 10-d-old plants. C, Relative gene expression of GAPCp1 and GAPCp2 in adult plants. Values are means ± sd (n = 3). D, Expression of GUS under the control of GAPCp1 and GAPCp2 promoters in flowers (D1 and D2), anthers (D3 and D4), pistils (D5), roots (D6), and leaves (D7–D10) of adult plants. Bars = 5 mm (B1 and B2), 1 mm (B3–B8, D1, D2, and D7–D10), and 0.25 mm (D3–D6).

