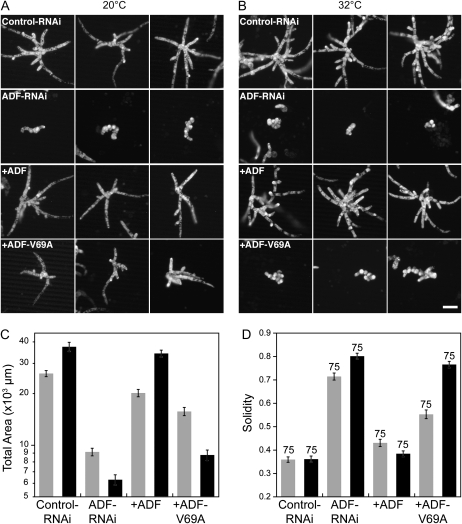
Figure 4.
ADF-V69A is temperature sensitive. A and B, Three representative micrographs of chlorophyll autofluorescence from 1-week-old moss plants grown at the indicated temperatures and transformed with the indicated constructs. Panels with a plus sign show plants transformed with the indicated construct in addition to the ADF-RNAi construct. Bar = 100 μm. C, Average area of chlorophyll autofluorescence from silenced plants. Area is plotted in a logarithmic scale due to the log normal distribution of the data. D, Average solidity values. Numbers above the bars indicate the total number of plants analyzed for each condition. Gray and black bars in C and D represent data acquired at 20°C and 32°C, respectively. Error bars represent se.

