Figure 4.
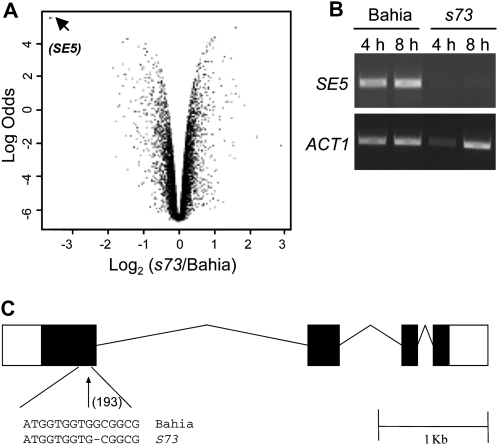
Volcano plot analysis, mRNA expression, and genomic structure of SE5. A, Volcano plot analysis of the differentially expressed genes detected in the microarray experiment. Statistical significance (ordinate) is plotted against fold change (abscissa) for each probe. Fold changes are provided as a log2 scale [log2(s73/Bahia)]. The log odds score (ordinate) represents the probability that the gene is differentially expressed. Arrowhead corresponds to SE5 score. B, SE5 expression in Bahia and s73 plants. Adult plants were grown for 1 week under 12 h light/12 h darkness conditions. RNA was isolated from leaf samples taken at 4 and 8 h after light was turned on and SE5 expression was analyzed by semiquantitative RT-PCR. Act1 was used as the control. C, Genomic structure of SE5. s73 shows a 1-bp deletion at position 193, located inside the first exon. Black boxes represent exons; white boxes represent the 5′-untranslated region (left) and the 3′-untranslated region (right), respectively.

