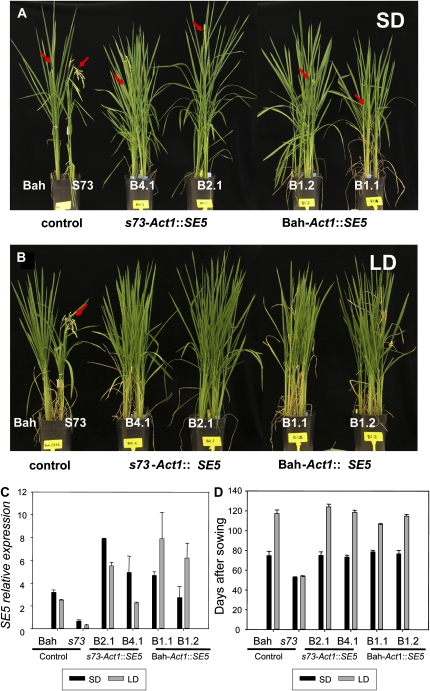
Figure 5.
Phenotypic comparisons (left to right) of Bahia (Bah), s73, s73-Act1∷SE5 (lines B4.1 and B2.1), and Bahia-Act1∷SE5 (lines B1.2 and B1.1) plants overexpressing SE5. A and B, Plants grown under SD (A) and LD (B) conditions for 11 weeks. Bahia plants are at the heading stage. s73 plants showed mature panicles, whereas Bahia, s73-Act1∷SE5, and Bahia-Act1∷SE5 showed emergent panicles, indicated by red arrows. C, SE5 relative mRNA levels in Bahia, s73, and transgenic plants overexpressing SE5 quantified by quantitative RT-PCR. Plants were grown under neutral day (12 h light/12 h dark) conditions for 2 weeks, and for an additional week under SD (10 h light/14 h dark; dark bars) or LD (14 h light/10 h dark; open bars) conditions. Relative mRNA levels were normalized to total RNA amounts. D, Days to heading of the Bahia, s73, and transgenic plants overexpressing SE5 grown under SD or LD conditions (n = 8).

