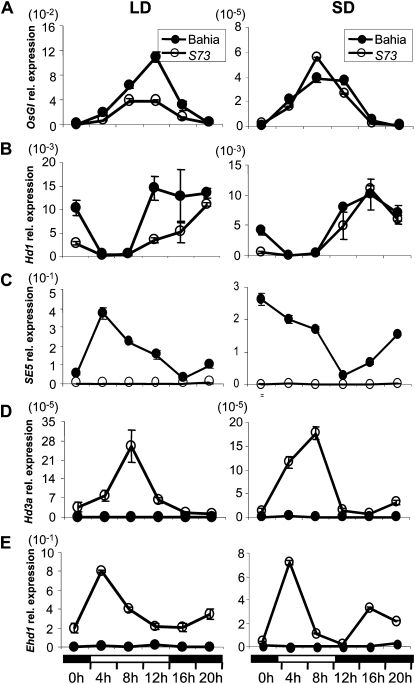
Figure 6.
Diurnal expression patterns of OsGI (A), Hd1 (B), SE5 (C), Hd3a (D), and Ehd1 (E) in Bahia (black circles) and s73 (white circles) plants as indicated by quantitative RT-PCR results. Plants were grown under neutral day (12 h light/12 h dark) conditions for 3 weeks, and for an additional week under SD (10 h light/14 h dark) or LD (14 h light/10 h dark) conditions. In all sections, the mean of each point is based on the average of three biological replicates. Black bars indicate dark periods, and white bars indicate light periods. Relative mRNA levels normalized to total RNA amounts are shown. The values presented are the mean of two biological replicates. Error bars indicate sd from the mean.

