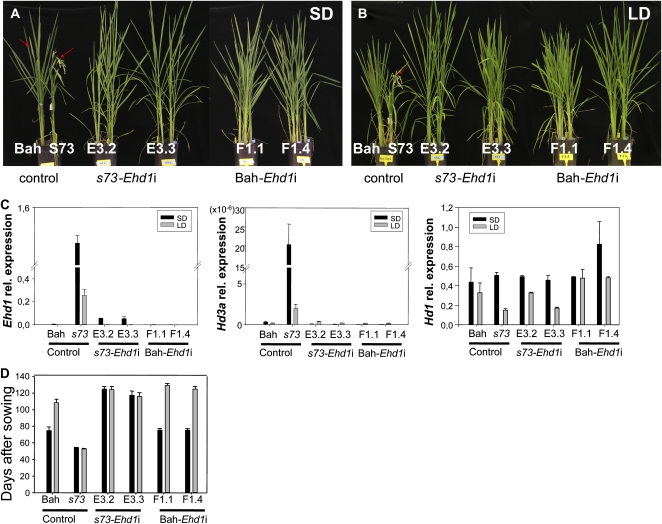
Figure 7.
Phenotypic comparisons (from left to right) of Bahia (Bah), s73, s73-Ehd1i (lines E3.2 and E3.3), and Bahia-Ehd1i (lines F1.1 and F1.4) plants. A, Plants growing under SD conditions. Pictures were taken when Bahia plants initiated the heading (11 weeks). s73 plants show mature panicles, whereas Bahia, s73-Ehd1i, and Bahia-Ehd1i show emergent panicles, indicated by red arrows. B, Plants growing under LD conditions. Pictures were taken 11 weeks after sowing. C, Ehd1, Hd3a, and Hd1 mRNA levels in Bahia, s73, and transgenic plants quantified by quantitative RT-PCR. Plants were grown under neutral day (12 h light/12 h dark) conditions for 2 weeks, and for an additional week under SD (10 h light/14 h dark) or LD (14 h light/10 h dark) conditions. RNA was isolated from leaf samples 4 h after the lights were turned on for Ehd1 and Hd3a analysis or 16 h for Hd1 analysis. Relative mRNA levels normalized to total RNA amounts are shown. Error bars indicate sd. D, Days to flowering of the Bahia, s73, s73-Ehd1i, and Bahia-Ehd1i p1ants grown under SD or LD conditions.

