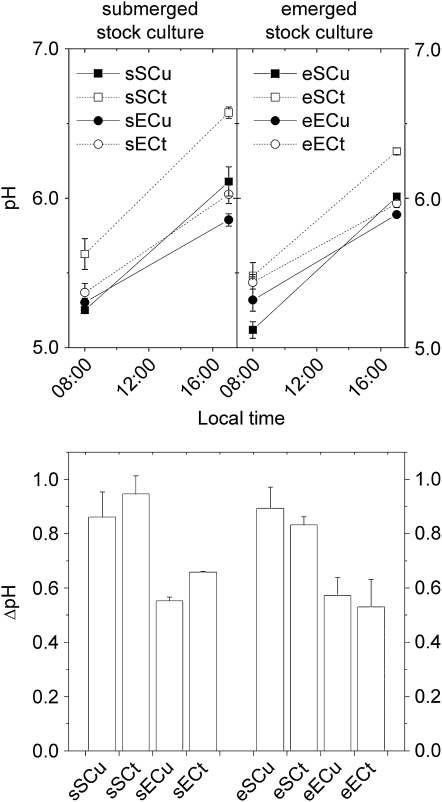
Figure 3.
Results of pH measurements of C. helmsii leaves for detecting circadian changes of acid content indicative of CAM. The lines between the morning and evening measuring points are only a visual aid for making it easier to see which pairs of points belong together; they do not imply that there would be a linear decrease of pH over the day. The data are averages of two independent experiments. Treatment labels are as follows: e, emerged stock culture; s, submerged stock culture; E, experiment (treatment) in emerged state; S, experiment in submerged state; Cu, treated with 10 μm Cu2+; Ct, control (0.1 μm Cu2+).

