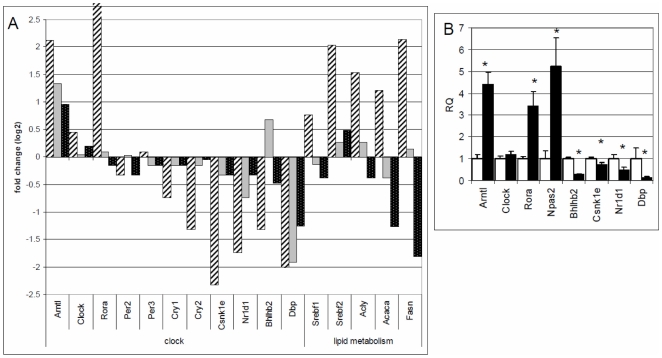
Figure 4. Changes in molecular signatures of circadian clocks genes and genes that regulate fatty acid synthesis during the transition from pregnancy to lactation.
A) Gene expression fold changes from pregnancy day 20 (P20) to lactation day 1 (L1) in core clock genes and genes involved in fatty acid synthesis in mammary (striped bars), liver (gray bars) and adipose (dotted bars). Gene expression was measured using Rat 230 2.0 Affymetrix GeneChips and a linear model in which tissue type was the fixed effect was used to identify genes that were uniquely up and down-regulated in each tissue. Values are log base 2 fold change. B) Relative gene expression (RQ) of core clock genes was also measured in mammary tissue on P20 (white bars) and L1 (gray bars). Values are mean RQ (n = 5) ± SEM; * indicates a significant difference in gene expression on L1 relative to P20.

