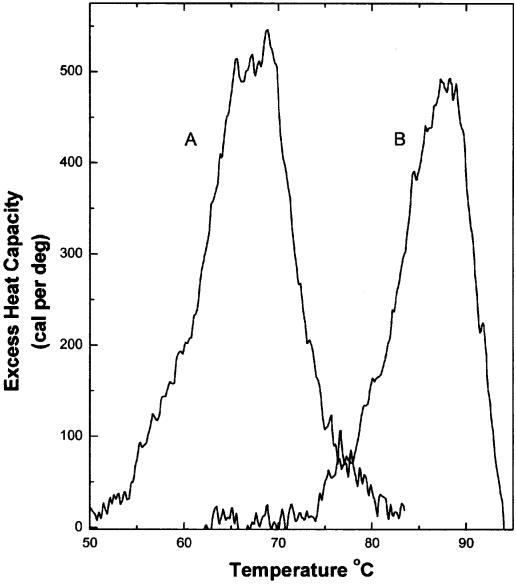
Figure 2.
Results of DSC experiments. Melting curves are shown for herring sperm DNA at 1 mM (bp) concentration (A) and for an identical DNA solution with saturating amounts (0.16 mol antibiotic/mol bp) of echinomycin added (B). The areas under the peaks provide direct estimates of the enthalpy for melting of the DNA duplex (A) and the echinomycin–DNA complex (B).

