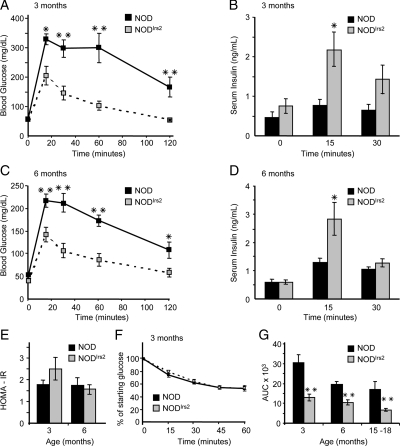
Figure 4.
Glucose sensitivity and insulin secretion. A and C, Glucose tolerance test after a 16-h fast at 3 and 6 months of age in NODIrs2 and NOD mice (n = 4–7 mice/group). B and D, Serum insulin concentrations during the GTT were determined by ELISA at indicated time points. E, Estimation of insulin resistance by the HOMA2 approximation. F, Insulin tolerance tests. G, Area under the curve for GTT at 3, 6, and 15–18 months of age. *, P < 0.05; **, P < 0.01. Statistical significance was determined using unpaired Student t tests.

