Figure 5.
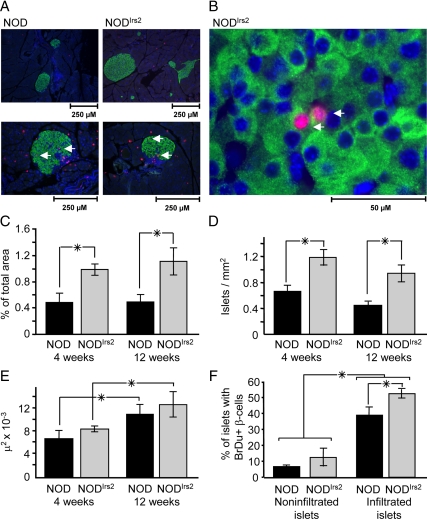
β-Cell mass and mitogenesis in NOD and NODIrs2 mice. Pancreas sections were formaldehyde fixed, paraffin embedded, and stained for with antibodies against insulin (green) and BrdU incorporation (red). Nuclei were labeled with DAPI (blue). A, Representative sections from 8-wk-old mice showing replicating β-cells double labeled with insulin and BrdU. B, High-magnification image demonstrating BrdU staining in the nuclei of insulin-positive β-cells. C, The percentage of islet area per pancreas. D, The number of islets per square millimeter of pancreas area. E, Mean islet size. F, The percentage of the infiltrated and noninfiltrated islets containing replicating β-cells (n = 6 mice/group). All results are expressed as the mean ± sem (n = 5–7 mice/group). *, P < 0.05.

