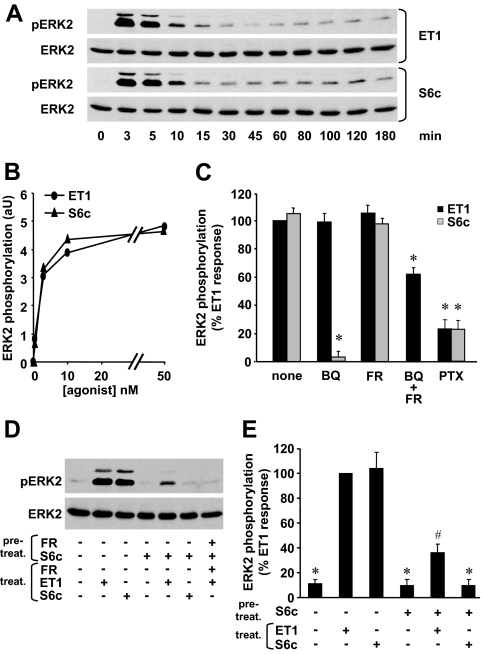
Figure 5.
Role of ETA and ETB in ET-1-induced ERK1/2 activation in ELT3 cells. A, ELT3 cells were incubated for the indicated times in the presence of 10 nm ET-1 or 10 nm S6c. Phosphorylated ERK1/2 (pERK1/2) and total ERK2 were detected as described in Fig. 1. Result is of a typical experiment among three performed. B, ELT3 cells were incubated for 5 min with ET-1 or S6c concentrations ranging from 0.5 to 50 nm. Phosphorylated ERK2 and total ERK2 bands were quantified. The levels of ERK2 phosphorylation were normalized with respect to total ERK2 amount in each sample and expressed in arbitrary units (aU). Each point represents the mean value of duplicate measurements. Result is of a typical experiment among three performed. C, ELT3 cells were preincubated either for 30 min with 1 μm BQ788 (BQ) or 1 μm FR 139317 (FR) or 1 μm BQ788 + 1 μm FR 139317 (BQ + FR) or for 14 h with 100 ng/ml PTX before a 5-min stimulation with 10 nm ET-1 or 10 nm S6c. The levels of ERK2 phosphorylation were calculated as in B and expressed as percent of ET-1 response. Values are the mean ± sem of three to six separate experiments performed in duplicate. *, P < 0.05 vs. ET1-treated cells. D, ELT3 cells were desensitized or not for 30 min by a pretreatment with 50 nm S6c with or without 1 μm FR 139317 (FR) during this pretreatment (pretreat.). The media were changed and the cells were then stimulated or not for 5 min by 50 nm ET-1 or 50 nm S6c in the presence or absence of 1 μm FR 139317 (treat.). Result is of a typical experiment among four performed. E, ELT3 cells were pretreated or not for 30 min with 50 nm S6c (pretreat.). The media were changed and the cells were then stimulated or not for 5 min by 50 nm ET-1 or 50 nm S6c (treat.). The levels of ERK2 phosphorylation were calculated as above and expressed as percent of ET-1 response. Values are the mean ± sem of four separate experiments performed in duplicate. *, P < 0.05 vs. ET1-treated cells; #, P < 0.05 vs. untreated S6c-desensitized cells.

