Abstract
In vivo temperatures were correlated to the whole head average specific absorption rate (SARavg) at 9.4T using 12 anesthetized swine (mean animal weight = 52 kg, standard deviation = 6.7 kg). Correlating the temperatures and SARavg is necessary to ensure safe levels of human heating during ultra-high field MR exams. The temperatures were measured at three depths inside the brain, in the rectum, and at the head-skin of swine. A 400 MHz, continuous wave RF power was deposited to the head using a volume coil. The SARavg values were varied between 2.7–5.8 W/kg. The RF power exposure durations were varied between 1.4 –3.7 hr. To differentiate the temperature response caused by the RF from that of the anesthesia, the temperatures were recorded in four unheated swine. To study the effect of the spatial distribution of the RF and tissue properties, the temperature probes were placed at two brain locations (n = 4 swine for each location). Results showed that the in vivo brain temperatures correlated to the SARavg in a geometry-dependent manner. Additionally, 1) the skin temperature change was not the maximum temperature change; 2) the RF heating caused an inhomogeneous brain temperature distribution; and 3) the maximum temperature occurred inside the brain.
Keywords: RF safety, RF heating, bioheat thermal model, high field MRI
The ultra-high field magnetic resonance (UHF-MR) systems (i.e., the systems with the Larmor water proton resonance frequency ≥128 MHz) deposit more RF power to an imaged tissue compared to smaller MR systems (1–5) for the same pulse sequence. This RF power is deposited nonuniformly (6 –9). The higher conductivity of biological tissues and frequency-dependent dielectric losses at higher field strengths cause more RF absorption. Further, more RF power is required to achieve a specific spin excitation inside the deep tissues at UHF. The RF power may cause the local specific absorption rate (SAR) and/or the local temperature to exceed RF safety guidelines (10 –12). Maximum SAR does not always correlate spatially with the maximum local in vivo temperature due to blood flow. Therefore, to comply with the safety guidelines determining the SARs and in vivo temperatures are necessary.
To determine the SAR, researchers have simulated the Maxwell equations in spherical phantoms and more realistic human geometries for frequencies up to 500 MHz (7,9,13). In addition, Cline et al. (14) measured the SAR using thermal maps in a uniform spherical phantom at 128 MHz. Roschmann (2) measured the whole head average SAR (SARavg) using the quality factor in volunteers and metallic phantoms for frequencies up to 220 MHz. Vaughan et al. (1) measured the SAR using the relative signal intensity and the RF transmit power in a human head at 170 MHz and 300 MHz.
To determine in vivo temperatures, researchers have simulated the classical Pennes’ bioheat transfer equation (BHTE) (15). Hand et al. (16) simulated the BHTE in a human leg for frequencies up to 213 MHz. Trakic et al. (17) simulated the BHTE in rats for frequencies between 500 and 1000 MHz. Collins et al. (18) simulated the BHTE in a human head at 300 MHz. In addition, Kangarlu et al. (8) measured temperatures using fluoroptic probes in a human head phantom filled with ground turkey breast at 340 MHz.
Excessive temperature (and not the SAR) causes cellular thermal injury (19 –21). Therefore, it is prudent to determine in vivo temperatures compared to the SAR to ensure human safety in UHF-MR systems. BHTE is the most widely studied and is an accurate bioheat equation (22,23). However, it has been shown to produce erroneous temperatures in the presence of a vasculature (24). Further, in vivo temperature measurements using MR have an accuracy of ≈O(±1°C) (25,26). This accuracy range is outside the safe in vivo temperature variation permissible by safety guidelines. Lack of a suitable bioheat thermal model and an MR temperature measurement technique makes, respectively, offline estimation and online determination of in vivo temperatures unreliable to ensure human safety in UHF-MR systems. Further, in vivo temperatures in heated tissues strongly depend on blood perfusion (27,28). Blood perfusion redistributes the incident RF energy and can cool as well as heat tissue. Therefore, the inclusion of blood perfusion effects in phantom and animal models is necessary to appropriately estimate the SAR-induced in vivo temperatures (29).
The physiological response to RF heating is triggered by the local SAR and not the SARavg. However, the SARavg—not the local SAR—is routinely monitored in MR systems. Therefore, correlating the local temperatures and the SARavg will better ensure RF safety at UHF. This article presents the first effort to correlate the RF-induced brain temperature changes and the whole-head average SAR (SARavg) in human-sized, anesthetized mammals at UHFs. Specifically, to obtain the correlation the temperature changes were measured in the swine brain at three depths and at two locations, and on the head-skin at 400 MHz for various values of the SARavg and the RF power deposition durations. Our hypothesis was that the SARavg could be correlated to the in vivo temperatures for a given coil and perfused head geometry.
MATERIALS AND METHODS
Experiment Design
The animal experiment protocol was approved by the Institutional Animal Care and Usage Committee (IACUC) of the University of Minnesota.
In vivo temperatures were measured as a function of time in 12 human-sized, anesthetized swine. The measurements were made using an inline fluoroptic probe (Luxtron, Santa Clara, CA; model 3000) at the depths of 15 mm, 10 mm, and 5 mm in the brain and using a separate fluoroptic probe (Luxtron; model m3300) at the head-skin. All four in vivo temperatures were recorded continuously. In one of the animals no temperature data could be obtained at the 5 mm depth since the inline probe transducers were placed accidentally at depths of 10 mm, 15 mm, and 20 mm. Since anesthesia affected in vivo temperatures, to understand the temperature response caused by the anesthesia (and to separate this temperature response from that of the RF) the temperatures were recorded in four unheated, anesthetized swine (mean animal weight = 49.8 kg, standard deviation [SD] = 9.1 kg) for the typical duration of a heating experiment (≈8 hr). To study the effect of the RF power distribution and the local brain tissue thermal/electrical properties and blood perfusion on the in vivo temperatures, the inline probe was placed in the brain at two different locations (n = 4 for each location). First location was 35 mm away from the joint of skull and neck (mean animal weight = 48.9 kg, SD = 3.6 kg). A second location was 40 mm away from the joint of skull and neck (mean animal weight = 57.5 kg, SD = 3.0 kg). Both locations were 5 mm right of the line passing between the two ears of the animal and dividing the head in two equal halves. The inline probe location was chosen such that the probe was placed well within the brain and away from the preoptic and thalamus regions. The in vivo temperature change induced by the RF heating alone was obtained by subtracting the temperature response caused by the anesthesia from the absolute temperature response measured directly (elaborated below in the Results and Discussion sections). The rectal temperature was monitored by placing a thermistor or fluoroptic temperature probe 10 cm deep in the rectum.
A CW RF power was delivered to the swine head using a four loop volume head coil tuned and matched at 400 MHz (Larmor frequency of water proton at 9.4T). The net RF power delivered (forward-reverse) was measured at the head coil using a power meter (Giga-tronics, San Ramon, CA; Universal Power Meter, model 8650A). RF safety guidelines recommend SARavg = 3 W/kg as safe for head imaging. Therefore, the SARavg was varied between 2.7 and 5.8 W/kg to study the resultant in vivo temperature change. The RF heating duration was varied between 1.4 – 3.7 hr (Table 1). The SARavg was calculated by dividing the RF power with the animal’s head weight. For the four animals of Location 1 the animal’s head weight was obtained after the experiments. For the four animals of Location 2 the head weight was estimated from other, approximately same-weight animals. This was feasible since similar-weight animals demonstrated approximately the same head dimensions. The weight of the animal’s ears was not included in the SARavg calculations since the ears stayed outside the RF coil.
Table 1.
Whole-Head Average Specific Absorption Rate and RF Heating Duration for Swine
| Location 1 |
Location 2 |
||||
|---|---|---|---|---|---|
| N | SARavg (W/kg) | RF duration (hr) | N | SARavg (W/kg) | RF duration (hr) |
| 1 | 2.7 | 3.0 | 1 | 5.6 | 3.6 |
| 2 | 3.2 | 3.7 | 2 | 5.8 | 1.4 |
| 3 | 2.9 | 3.4 | 3 | 4.6 | 3.1 |
| 4 | 3.0 | 1.6 | 4 | 3.0 | 2.6 |
Swine were selected for these experiments for their human comparable thermal mass, surface area, cardiac output, thermal properties, and thermoregulatory mechanisms as well as ease of availability (30,31). The number of animals was chosen as n = 4 for each of the three groups since according to the statistical power analysis a minimum number of n = 3.16 animals was required for each group to have >90% power with P < 0.05 (two-sided). The three groups were: 1) unheated animals, 2) heated animals with the inline probe placed at Location 1, and 3) heated animals with the inline probe placed at Location 2. The room temperature and humidity and the animal’s heart rate, blood pressure, end tidal CO2, and the percent inspired/expired anesthetic agent isoflurane were monitored continuously to keep swine stable and recorded manually every 30 min.
Swine were rested for 6 days after they were transported to the Center for Magnetic Resonance Research animal facility to avoid anxiety. They were fasted for 12 hr to avoid complications during induction of anesthesia (32). Water was provided ad libitum during the fasting. For the experiments, first the animal was immobilized and sedated using 5–10 mg/kg Telazol (tiletamine HCl + zolzepam HCl). Some of the animals were also given 5–10 mg/kg of Pentothal (thiopental sodium) to deepen the sedation and reduce pain sensation, if any. This was followed by tracheotomy or intubation. Swine were kept anesthetized during experiments (≈8 hr) using 2–3% isoflurane in 50%–50% air-O2. Respiratory rate was set to 12–13 cycles/min using a ventilator (Ohmeda 7000; GE HealthCare, Milwaukee, WI). Minute volume was set between 6 – 8 L/min. Saline (0.9% NaCl) was provided through an ear vein to keep swine hydrated during experiments. Afterwards, a ≈14G hole was drilled into the skull perpendicular to the RF coil plane closest to the skull. The dura was punctured using an 18G catheter. The inline fluoroptic probe was slipped through the hole such that the probe’s three transducers were placed at the predetermined depths away from the dura in the brain. A piece of cotton gauge was put in the hole to keep the fluoroptic probes stationary and stop cerebral spinal fluid (CSF) from leaking. The other fluoroptic probe was placed at the head-skin under the cutaneous layer using an 18G catheter. Animals were euthanized using a saturated KCl solution at the end of experiments. The animal’s head was severed, weighed, and measured to calculate the SARavg.
Statistical Analysis
The in vivo temperature changes caused by the RF heating alone were normalized by the SARavg and the RF heating duration. For all three depths the hypothesis that this temperature change varied with location was tested by comparing the temperature curves at a given depth across the two locations. Hypotheses that the temperature changes were different at different depths were tested by comparing the temperatures among the three depths and skin at both locations. Average population-averaged parametric temperature curves of the following form were obtained:
where, tN = normalized time, i.e., time in hours divided by the total RF heating time in hours. Corresponding 95% confidence interval (CI) curves were also obtained. The above form of the average parametric curves was chosen since the form was similar to the form of the solution of the Pennes’ BHTE for a constant thermal diffusion and blood perfusion.
RESULTS
The normalized temperature changes vs. normalized RF heating duration are presented at the depth of 10 mm in the brain for locations 1 and 2 in Figs. 1 and 2, respectively. The corresponding average parametric curves with the 95% CI curves are also presented in the figures. It was shown that the RF-induced normalized brain temperature change was unique for a location. As mentioned in the last section, the normalized temperature change was obtained by dividing the in vivo temperature change induced by the RF heating alone with the SARavg and the RF heating duration. The in vivo temperature change induced by the RF heating alone was obtained by subtracting the temperature response induced by the anesthesia from the net temperature response measured. The normalized time was obtained by dividing the time with the RF heating duration. The normalized temperature changes for 15 mm and 5 mm depths were similar in behavior and are not presented to save space.
FIG. 1.
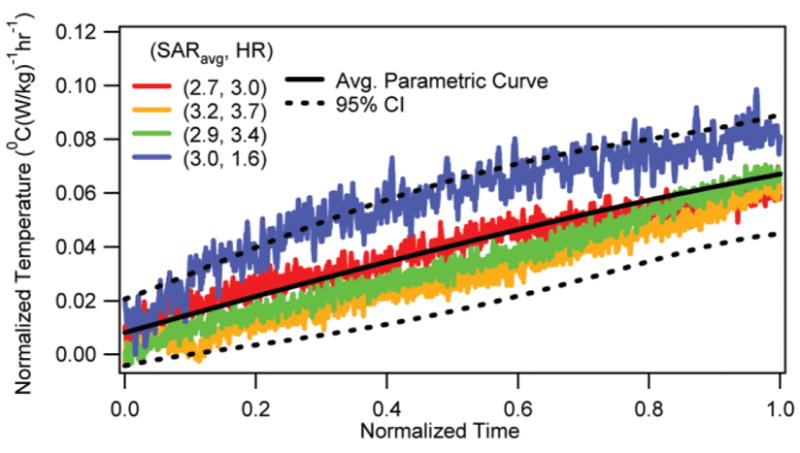
Normalized temperature change vs. normalized RF heating duration at the depth of 10 mm for Location 1 with corresponding average parametric curve and 95% CI curves.
FIG. 2.
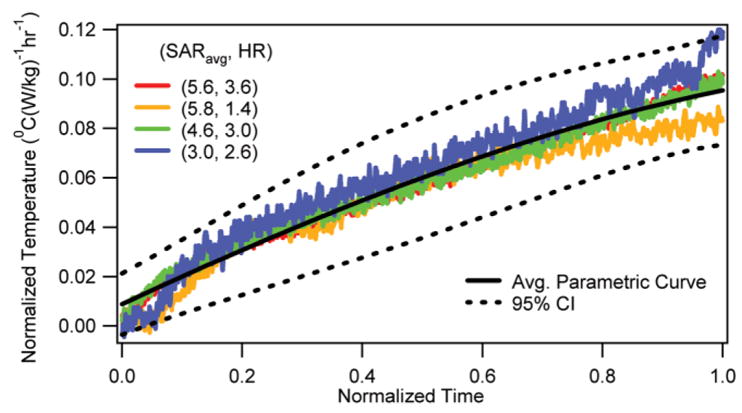
Normalized temperature change vs. normalized RF heating duration at the depth of 10 mm for Location 2 with corresponding average parametric curve and 95% CI curves.
The normalized temperature changes vs. normalized RF heating duration in the head-skin of the RF-heated swine (n = 8; i.e., n = 4 for each location) are presented in Fig. 3. The corresponding average parametric curve and the 95% CI curves are also presented. It was shown that the RF-induced normalized skin temperature changes were non-unique.
FIG. 3.
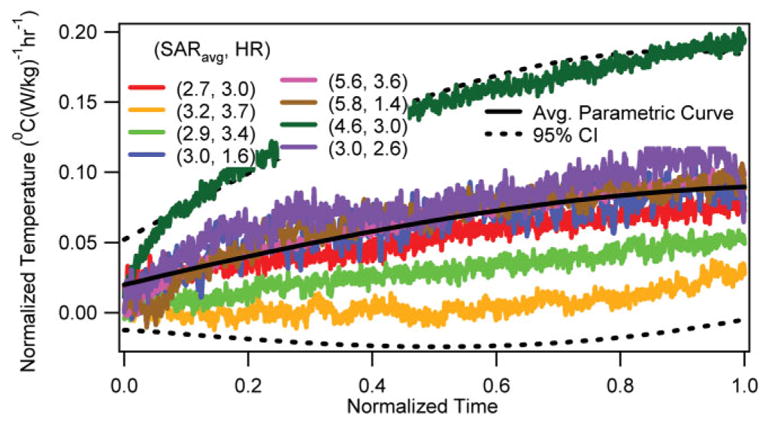
Normalized temperature change vs. normalized RF heating duration at the head-skin with corresponding average parametric curve and 95% CI curves.
The normalized rectal temperature changes vs. normalized RF heating duration (n = 4 for Location 1) are presented in Fig. 4. The corresponding average parametric curve and the 95% CI curves are also presented. It was shown that the RF induced normalized rectal temperature changes were unique. However, the slopes were smaller than the slopes of brain temperatures (Fig. 5). The rectal temperature measurements made using thermistor probes in the other four RF-heated animals are not presented since they were unreliable and showed frequent peaks in temperatures due to the presence of the RF environment.
FIG. 4.
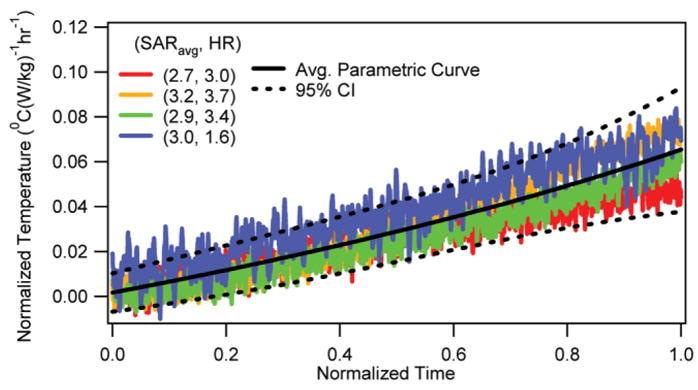
Normalized rectal temperature change vs. normalized RF heating duration with corresponding average parametric curve and 95% CI curves.
FIG. 5.
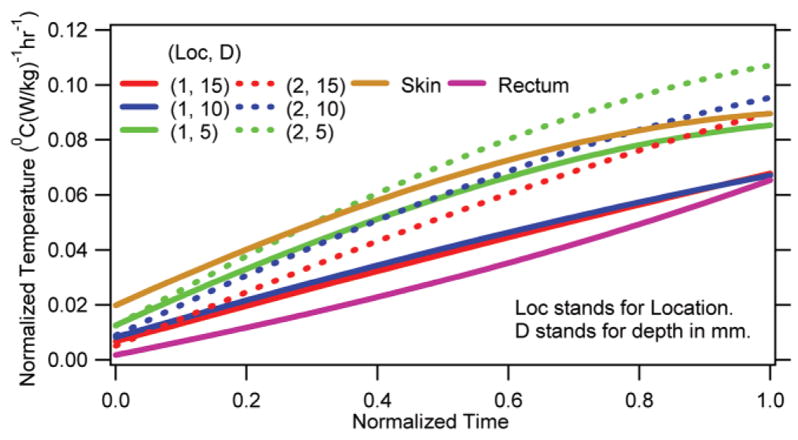
Average normalized parametric curves for the brain, rectum, and head-skin.
The average parametric curves for the three depths at both locations are presented in Fig. 5. The average curve for the rectum and skin are also presented in the figure for comparison. It was shown that the RF induced normalized temperature changes were significantly different from one another. In Figs. 6 and 7 are presented, respectively, a representative linear temperature decay of an unheated, anesthetized animal and an absolute temperature response of an RF-heated, anesthetized animal. It was shown that the anesthesia caused a linear temperature decay in swine. Further, the linear temperature decay was animal-specific (compare Fig. 6 and the pre-RF region of Fig. 7). The maximum temperature occurred inside the brain (Fig. 7).
FIG. 6.
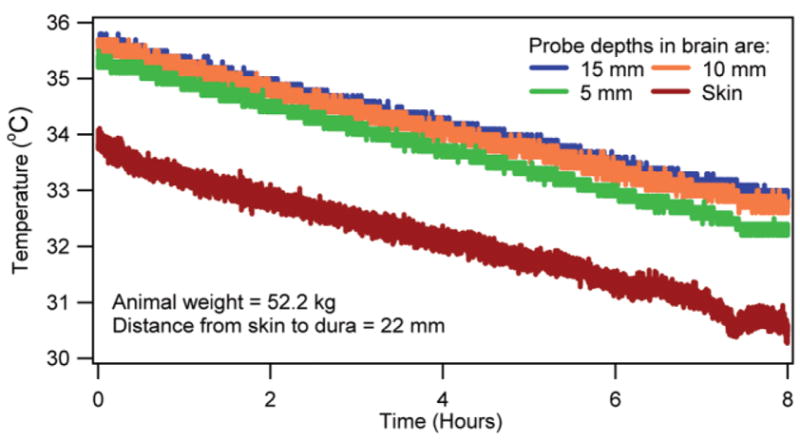
Temperatures in the brain and head-skin of an anesthetized, unheated animal.
FIG. 7.
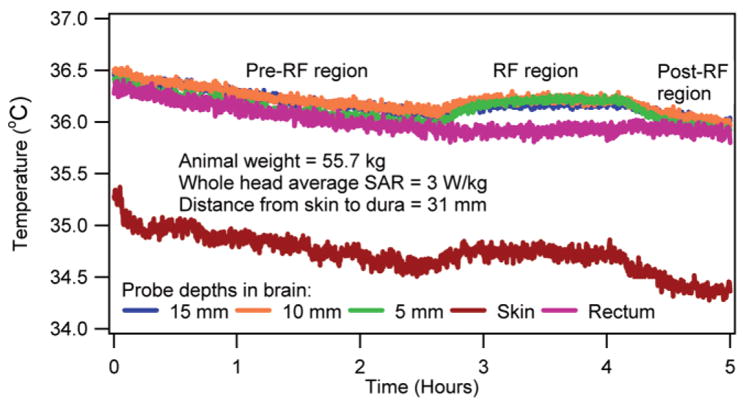
Temperatures in the brain, rectum, and head-skin of an anesthetized, heated animal.
DISCUSSION
Several important observations were made. First and most important, the SARavg and the RF-induced normalized brain temperature changes could be correlated. This observation was apparent from the nearly overlapping temperature curves presented in Figs. 1 and 2. The observation was useful since it suggested that for a predetermined SARavg and RF heating duration the RF-induced brain temperature change could be estimated by multiplying the average parametric curves with the SARavg and the RF heating duration. The nearly overlapping temperatures were easily explained as follows. In vivo temperature was affected by thermal capacity, power distribution, thermal diffusion, and blood perfusion. Swine had approximately the same head dimensions. Thus, the thermal capacity (i.e., the tissue density multiplied by the specific heat) at a fixed brain location was relatively unchanged. Further, for a given frequency, head position inside a coil, and approximately the same head dimensions the relative electric field distribution and, thus, the relative RF power distribution were fixed. Therefore, the RF power distribution when normalized by the SARavg presented approximately the same spatial RF power distribution among all swine. Swine weighed comparably (Location 1: mean animal weight = 48.9 kg, SD = 3.6 kg; Location 2: mean animal weight = 57.5 kg, SD = 3.0 kg). Thus, they had comparable blood perfusion. Locally comparable thermal capacity, RF power, and blood perfusion would result in comparable temperature distributions and, thus, comparable thermal diffusion effects. Therefore, an RF coil would cause a spatially unique normalized tissue temperature change for a normalized RF heating time between 0 –1 if blood perfusion and thermal diffusion effects were relatively unchanged and/or changed comparably among swine during the RF heating. Note that the coupling of the animal head, which is head size- and position-dependent, is important for the RF power distribution at UHFs. Also, tuning of the coil is important. The effects of the relative variation in head-tissue composition, head-geometry composition, head loading, and tuning are inherently included in the normalized temperature results. Further, the obtained pattern of temperature nonhomogeneity is coil- and head geometry-specific since the normalized results were obtained for a fixed coil and comparably weighed animals with comparable head size. As mentioned in the Results section, the RF-induced temperature change was obtained by subtracting the temperature response induced by the anesthesia from the net temperature response measured. The temperature response of anesthesia was predicted by extrapolating the linearly decaying temperature of the animal obtained prior to the RF application for each animal (e.g., see the pre-RF region in Fig. 7). This extrapolation of the linearly decaying temperature for the duration of RF application was valid since 1) the temperatures decayed linearly in anesthetized, unheated swine (Fig. 6), and 2) the slope of the linear temperature decay was unique to each swine (e.g., compare Fig. 6 and the pre-RF region in Fig. 7).
Second, the SARavg and the RF-induced normalized skin temperature change could not be correlated. This observation was apparent from the wide variability in the normalized skin temperature change curves obtained in the eight animals (Fig. 3). Comparing Fig. 3 with Figs. 1 and 2, the wide variability implied that the skin temperature change might/might not be the maximum temperature change during UHF MR scans. Therefore, the skin temperature change was an unreliable parameter to gauge in vivo temperature change. The observation was easily explained as follows. Mammals extensively change skin blood perfusion to thermoregulate (33). This was verified visually in our experiments for all heated pigs. Skin of the animals turned pink during RF heating. Variable and time varying change in the skin blood perfusion among swine changed the RF-induced temperature response and the thermal diffusion effects (which in turn also affected the temperature response).
Third, the RF-induced normalized in vivo temperature change was nonuniform. Also, the temperature change varied with time nonlinearly (Fig. 5). These observations stressed the development of the average parametric in vivo temperature change curves to ensure human RF safety during UHF MR scans. Further, the nonlinearity indicated that obtaining temperature predictions by directly equating the SAR and/or SARavg to the time rate of change of in vivo temperature was inappropriate. These observations were easily explained since the thermal capacity, RF power, thermal diffusion, and blood perfusion varied spatially in a swine. Further, the thermal effects of blood perfusion changed over time. This was verified by monitoring change in the swine rectal temperature during an RF heating (e.g., Figs. 4, 5, 7). As mentioned before, nonuniformity of the temperature distribution was verified by comparing the average parametric curves among depths for the same location and among locations for the same depth. Comparisons with the skin curve were also made. For all cases P ≤0.05.
Fourth, the RF heating raised the rectal temperature. However, the rectal temperature change was smaller than the brain temperature change (Figs. 4, 5, 7). This observation suggested that the animal was unable to dissipate all of the RF energy. The fractional RF energy dissipation caused the rectal temperature to rise at a slower rate. Further, the RF energy dissipation capability was comparable in all four animals (Fig. 4).
Fifth, the in vivo temperatures dropped linearly in anesthetized, unheated swine (e.g., Fig. 6). The linear temperature drop continued for ≥8 hr, which was a typical duration of the heating experiments. Further, as stated before, the temperature drop was unique to each swine. This observation was easily explained since isoflurane is a vasodilator. The vasodilation increased the peripheral vessel surface area exposed to ambient (34). This increased cutaneous heat loss. An animal-dependent vasodilation will cause an animal-dependent decrease in in vivo temperatures.
Sixth and last, the maximum absolute temperature was inside the brain. This observation suggested that a brain temperature might violate the RF safety guidelines before a skin temperature at 9.4T (e.g., Fig. 7). This observation was easily explained as follows. Mammals maintain nearly uniform core temperature well. Further, temperature at the skin was several degrees lower than the core temperature. Also, allowable temperature change in the safety guidelines is less for brain compared to periphery.
Comparing the present study with previous studies, Barber et al. (35) measured the RF-induced maximum temperature change in the head-skin and jugular vein of 0.2 and 0.1°C (W/kg)−1 hr−1, respectively, at 64 MHz. Kangarlu et al. (8,36) measured the brain temperature change of 0 –1.05°C (W/kg)−1 hr−1 in nonperfused head phantoms filled with ground turkey at 340 MHz. Adair et al. (37) measured the maximum skin temperature change of 0.12°C (W/kg)−1 hr−1 at 450 MHz. The results presented by Barber et al. and Adair et al. are in excellent agreement with our results. The results presented by Kangarlu et al. are also in reasonable agreement with our results. Comparison with the RF-induced temperature changes presented in Shellock and Crues (38) could not be made since the heating time corresponding to the maximum temperature change was unavailable.
Regarding limitations of the study, note that the RF power distribution depends on the geometry and electrical properties of tissue. In vivo temperature distribution depends on the geometry, thermal properties, and blood perfusion. Lack of similarities in the human and swine head geometry, electrical and thermal properties, and spatial blood perfusion distribution prohibits extrapolating our results to humans. Further, anesthesia changes thermoregulatory thresholds and blood flow distribution in mammals (30). This will affect in vivo temperature response induced by an RF power distribution.
CONCLUSIONS
The whole-head average specific absorption rate was correlated with the RF-induced, brain temperature change in anesthetized swine in a geometry-dependent manner. The RF heating-induced skin temperature change was not the maximum in vivo temperature change at 9.4T.
Acknowledgments
CA94318, R01-EB00895, R01-EB00454, CA94200, BTRR-P41 RR008079; Grant sponsor: Keck Foundation. NIH CA94318, NIH R01-EB00895, NIH R01-EB00454, NIH CA94200, NIH BTRR-P41 RR008079, NIH C06 RR17557-01, NIH C06 RR12147-01.
References
- 1.Vaughan JT, Garwood M, Collins CM, Liu W, DelaBarre L, Adriany G, Andersen P, Merkle H, Goebel R, Smith MB, Ugurbil K. 7T vs. 4T: RF power, homogeneity, and signal-to-noise comparison in head images. Magn Reson Med. 2001;46:24 –30. doi: 10.1002/mrm.1156. [DOI] [PubMed] [Google Scholar]
- 2.Roschmann P. Radiofrequency penetration and absorption in the human body: limitations to high-field whole-body nuclear magnetic resonance imaging. Med Phys. 1987;14:922–931. doi: 10.1118/1.595995. [DOI] [PubMed] [Google Scholar]
- 3.Jin J, Chen J. On the SAR and field inhomogeneity of birdcage coils loaded with the human head. Magn Reson Med. 1997;38:953–963. doi: 10.1002/mrm.1910380615. [DOI] [PubMed] [Google Scholar]
- 4.Chen J, Feng Z, Jin JM. Numerical simulation of SAR and B1-field inhomogeneity of shielded RF coils loaded with the human head. IEEE Trans Biomed Eng. 1998;45:650 – 659. doi: 10.1109/10.668756. [DOI] [PubMed] [Google Scholar]
- 5.Gandhi OP, Chen XB. Specific absorption rates and induced current densities for an anatomy-based model of the human for exposure to time-varying magnetic fields of MRI. Magn Reson Med. 1999;41:816 –823. doi: 10.1002/(sici)1522-2594(199904)41:4<816::aid-mrm22>3.0.co;2-5. [DOI] [PubMed] [Google Scholar]
- 6.Jin JM, Chen J, Chew WC, Gan H, Magin RL, Dimbylow PJ. Computation of electromagnetic fields for high-frequency magnetic resonance imaging applications. Phys Med Biol. 1996;41:2719 – 2738. doi: 10.1088/0031-9155/41/12/011. [DOI] [PubMed] [Google Scholar]
- 7.Nguyen UD, Brown JS, Chang IA, Krycia J, Mirotznik MS. Numerical evaluation of heating of the human head due to magnetic resonance imaging. IEEE Trans Biomed Eng. 2004;51:1301–1309. doi: 10.1109/TBME.2004.827559. [DOI] [PubMed] [Google Scholar]
- 8.Kangarlu A, Shellock FG, Chakeres DW. 8.0-Tesla human MR system: temperature changes associated with radiofrequency-induced heating of a head phantom. J Magn Reson Imaging. 2003;17:220 –226. doi: 10.1002/jmri.10236. [DOI] [PubMed] [Google Scholar]
- 9.Vaughan T, DelaBarre L, Snyder C, Tian J, Akgun C, Shrivastava D, Liu W, Olson C, Adriany G, Strupp J, Andersen P, Gopinath A, van de Moortele PF, Garwood M, Ugurbil K. 9.4T human MRI: preliminary results. Magn Reson Med. 2006;56:1274 –1282. doi: 10.1002/mrm.21073. [DOI] [PMC free article] [PubMed] [Google Scholar]
- 10.FDA. CDRH. Washington, DC: Food and Drug Administration; 2003. Guidance for industry and FDA staff — criteria for significant risk investigations of magnetic resonance diagnostic devices. [Google Scholar]
- 11.Bassen H, Schaefer DJ, Zaremba L, Bushberg J, Ziskin M, Foster KR. IEEE Committee on Man and Radiation (COMAR) technical information statement “exposure of medical personnel to electromagnetic fields from open magnetic resonance imaging systems, Zaremba, LA.” Zaremba, LA. Health Phys. 2005;89:684 – 689. doi: 10.1097/01.hp.0000172545.71238.15. [DOI] [PubMed] [Google Scholar]
- 12.International Commission on Non-Ionizing Radiation Protection, Oberschleissheim, Germany, Publisher: ICNIRP. Medical magnetic resonance (MR) procedures: protection of patients. 2004 [Google Scholar]
- 13.Keltner JR, Carlson JW, Roos MS, Wong ST, Wong TL, Budinger TF. Electromagnetic fields of surface coil In vivo NMR at high frequencies. Magn Reson Med. 1991;22:467– 480. doi: 10.1002/mrm.1910220254. [DOI] [PubMed] [Google Scholar]
- 14.Cline H, Mallozzi R, Li Z, McKinnon G, Barber W. Radiofrequency power deposition utilizing thermal imaging. Magn Reson Med. 2004;51:1129 –1137. doi: 10.1002/mrm.20064. [DOI] [PubMed] [Google Scholar]
- 15.Pennes HH. Analysis of tissue and arterial blood temperatures in the resting human forearm. 1948. J Appl Physiol. 1998;85:5–34. doi: 10.1152/jappl.1998.85.1.5. [DOI] [PubMed] [Google Scholar]
- 16.Hand J, Lagendijk J, Hajnal J, Lau R, Young I. SAR and temperature changes in the leg due to an RF decoupling coil at frequencies between 64 and 213 MHz. J Magn Reson Imaging. 2000;12:68 –74. doi: 10.1002/1522-2586(200007)12:1<68::aid-jmri7>3.0.co;2-2. [DOI] [PubMed] [Google Scholar]
- 17.Trakic A, Crozier S, Liu F. Numerical modelling of thermal effects in rats due to high-field magnetic resonance imaging (0.5–1 GHZ) Phys Med Biol. 2004;49:5547–5558. doi: 10.1088/0031-9155/49/24/010. [DOI] [PubMed] [Google Scholar]
- 18.Collins CM, Liu W, Wang J, Gruetter R, Vaughan JT, Ugurbil K, Smith MB. Temperature and SAR calculations for a human head within volume and surface coils at 64 and 300 MHz. J Magn Reson Imaging. 2004;19:650 – 656. doi: 10.1002/jmri.20041. [DOI] [PubMed] [Google Scholar]
- 19.Skibba JL, Powers RH, Stadnicka A, Cullinane DW, Almagro UA, Kalbfleisch JH. Oxidative stress as a precursor to the irreversible hepatocellular injury caused by hyperthermia. Int J Hyperthermia. 1991;7:749 –761. doi: 10.3109/02656739109056444. [DOI] [PubMed] [Google Scholar]
- 20.Wallen CA, Colby TV, Stewart JR. Cell kill and tumor control after heat treatment with and without vascular occlusion in RIF-1 tumors. Radiat Res. 1986;106:215–223. [PubMed] [Google Scholar]
- 21.Mackey MA, Dewey WC. Time-temperature analyses of cell killing of synchronous G1 and S phase Chinese hamster cells in vitro. Radiat Res. 1988;113:318 –333. [PubMed] [Google Scholar]
- 22.Kolios MC, Worthington AE, Sherar MD, Hunt JW. Experimental evaluation of two simple thermal models using transient temperature analysis. Phys Med Biol. 1998;43:3325–3340. doi: 10.1088/0031-9155/43/11/011. [DOI] [PubMed] [Google Scholar]
- 23.Moros EG, Dutton AW, Roemer RB, Burton M, Hynynen K. Experimental evaluation of two simple thermal models using hyperthermia in muscle In vivo. Int J Hyperthermia. 1993;9:581–598. doi: 10.3109/02656739309005054. [DOI] [PubMed] [Google Scholar]
- 24.Brinck H, Werner J. Use of vascular and non-vascular models for the assessment of temperature distribution during induced hyperthermia. Int J Hyperthermia. 1995;11:615– 626. doi: 10.3109/02656739509022494. [DOI] [PubMed] [Google Scholar]
- 25.Wlodarczyk W, Hentschel M, Wust P, Noeske R, Hosten N, Rinneberg H, Felix R. Comparison of four magnetic resonance methods for mapping small temperature changes. Phys Med Biol. 1999;44:607– 624. doi: 10.1088/0031-9155/44/2/022. [DOI] [PubMed] [Google Scholar]
- 26.Muacevic A, Peller M, Ruprecht L, Berg D, Fend L, Sroka R, Reulen HJ, Reiser M, Tonn J, Kreth FW. Image guided interstitial laser thermotherapy: a canine model evaluated by magnetic resonance imaging and quantitative autoradiography. Acta Neurochir (Wien) 2005;147:175–185. doi: 10.1007/s00701-004-0409-y. discussion 185–176. [DOI] [PubMed] [Google Scholar]
- 27.Song CW. Effect of local hyperthermia on blood flow and microenvironment: a review. Cancer Res. 1984;44(10 Suppl):4721s–4730s. [PubMed] [Google Scholar]
- 28.Song CW, Lokshina A, Rhee JG, Patten M, Levitt SH. Implication of blood flow in hyperthermic treatment of tumors. IEEE Trans Biomed Eng. 1984;31:9 –16. doi: 10.1109/TBME.1984.325364. [DOI] [PubMed] [Google Scholar]
- 29.Shrivastava D, Roemer RB. Readdressing the issue of thermally significant blood vessels using a countercurrent vessel network. J Biomech Eng. 2006;128:210 –216. doi: 10.1115/1.2165693. [DOI] [PubMed] [Google Scholar]
- 30.Mount LE. Adaptation to thermal environment — Man and his productive animals. Baltimore: University Park Press; 1979. [Google Scholar]
- 31.Duck F. In: Physical properties of tissue. Barrington EJ, Willis AJ, Sleigh MA, editors. London: Academic Press; 1990. [Google Scholar]
- 32.Becker BA, Niwano Y, Johnson HD. Physiologic and immune responses associated with 48-hour fast of pigs. Lab Anim Sci. 1992;42:51–53. [PubMed] [Google Scholar]
- 33.Christensen P, Hjarbaek J, Jensen B, Gronlund J. Measurement of transcutaneous PO2, PCO2 and skin blood flow at different probe temperatures using mass spectrometry. Acta Anaesthesiol Scand. 1991;35:631–634. doi: 10.1111/j.1399-6576.1991.tb03362.x. [DOI] [PubMed] [Google Scholar]
- 34.Brunton LL, Lazo JS, Parker KL. Goodman & Gilman’s the pharmacological basis of therapeutics. New York: McGraw-Hill; 2005. [Google Scholar]
- 35.Barber BJ, Schaefer DJ, Gordon CJ, Zawieja DC, Hecker J. Thermal effects of MR imaging: worst-case studies on sheep. AJR Am J Roentgenol. 1990;155:1105–1110. doi: 10.2214/ajr.155.5.2120944. [DOI] [PubMed] [Google Scholar]
- 36.Kangarlu A, Ibrahim TS, Shellock FG. Effects of coil dimensions and field polarization on RF heating inside a head phantom. Magn Reson Imaging. 2005;23:53– 60. doi: 10.1016/j.mri.2004.11.007. [DOI] [PubMed] [Google Scholar]
- 37.Adair ER, Kelleher SA, Mack GW, Morocco TS. Thermophysiological responses of human volunteers during controlled whole-body radio frequency exposure at 450 MHz. Bioelectromagnetics. 1998;19:232–245. doi: 10.1002/(sici)1521-186x(1998)19:4<232::aid-bem5>3.0.co;2-2. [DOI] [PubMed] [Google Scholar]
- 38.Shellock FG, Crues JV. Temperature changes caused by MR imaging of the brain with a head coil. AJNR Am J Neuroradiol. 1988;9:287–291. [PMC free article] [PubMed] [Google Scholar]


