Figure 4.
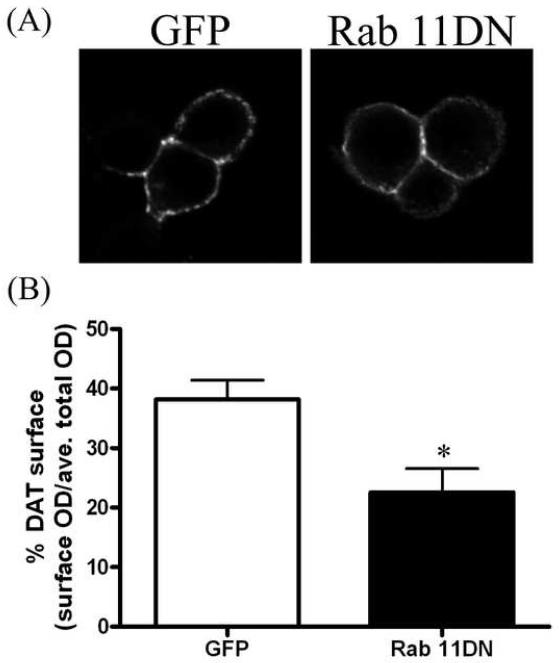
Rab 11DN reduces DAT surface expression. A, Representative images of N2A cells co-transfected with HA-DAT and GFP-vector (left) or GFP-Rab 11DN (right). Surface labeling of DAT is shown (average of 10 z-slices in the middle of the cell). B, Quantitation of surface labeling of GFP vector (n = 5) or Rab 11DN (n = 7) using Image J software. Data are plotted as percent DAT surface expression: optical density (OD) of surface (HA) staining divided by the average total DAT staining. Error bars represent SEM. *p<0.05 by unpaired two-tailed t-test.

