Figure 1.
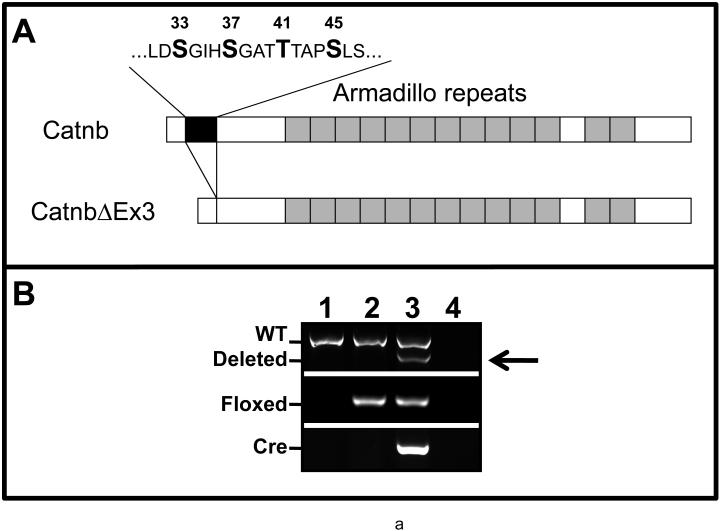
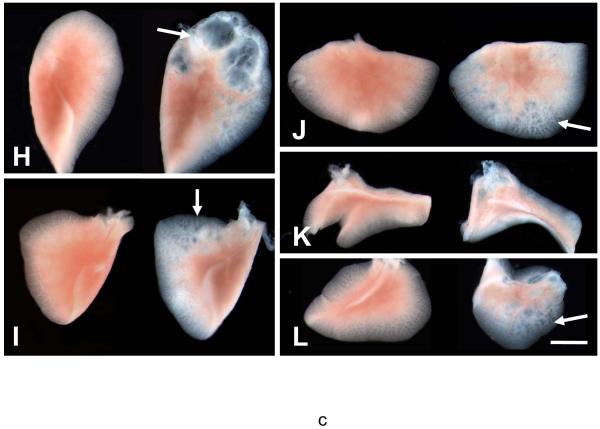
Panel A: Schematic illustration of Catnb and CatnbΔEx3 protein structures. 76 amino acids encoded by exon 3 (black box) is deleted in CatnbΔEx3. The deleted region contains phosphorylation sites of CK1 (S45) and GSK3β (S33, S37 and T41). Panel B: Deletion of exon 3 in CatnbEx3(cko/+) lung as determined by PCR. Genomic DNA was isolated from lungs of wild-type control (1), CatnbEx3(f/+) (2), and CatnbEx3(cko/+)(3) embryos and used in PCR analysis. Top panel shows PCR products amplified by CatnbF & CatnbR2 primers. PCR from the wild-type allele results in an 867 bp product, while the exon 3 deletion allele results in a smaller product (arrow). Center panel shows PCR products amplified by CatnbF & CatnbR1 primers. A product of 300 bp was amplified from the exon 3 floxed allele. Bottom panel shows PCR products amplified by cre primers. Lane 4 shows PCR reactions with H2O instead of DNA, and was used as negative control. Panels C and D show whole-mount photo of E18 control (C) and CatnbEx3(cko/+) (D) lungs, respectively. High magnification images of control (E) and mutant (F & G) tracheas are shown. Arrows in panel G indicate polyp-like structures along the mutant trachea. Comparison of the control (left) and mutant (right) lung lobes were shown in panels H to L. Scale bar: 1 mm(C, D, H-L); 250 um (E-G).


