Figure 2.
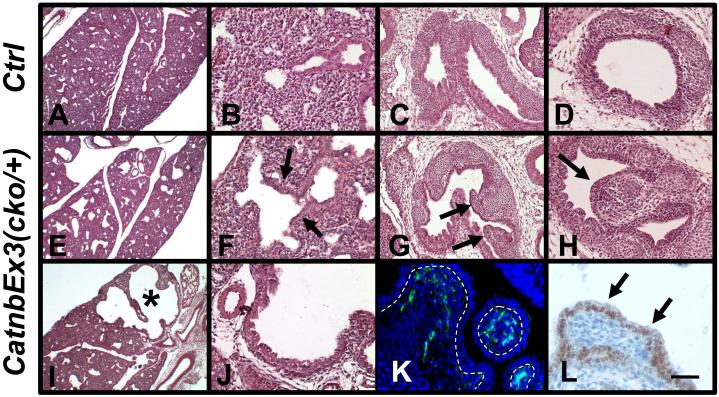
H&E staining of E16 control (A to D) and CatnbEx3(cko/+) (E to J) lungs. Arrows in F indicate dilation of primitive bronchial-alveolar duct junction in mutant lung. Asterisk in panel I indicates a severely dilated area in the mutant lung. Frontal plans of main-stem bronchi are shown in panels C and G. Arrows in G indicate polyp structures in the mutant main-stem bronchi. Trachea sections of control and mutant are shown in panels D and H, respectively. Arrow in H indicates polyp structures in the mutant trachea.
Mesenchymal cells of the polyps were labeled by immunostaining with vimentin antibody (green, K) and the epithelial cells (arrows, L) were labeled by Nkx2.1 antibody. Doted lines in panel K indicate epithelial-mesenchymal adjunctions. Morphology of the tissue in panel K was shown by DAPI-staining. Scale bar: 400 um (A, E, I); 80 um (B, D, F, H, J); 120 um (C, G); 40 um (K, L).

