Figure 9.
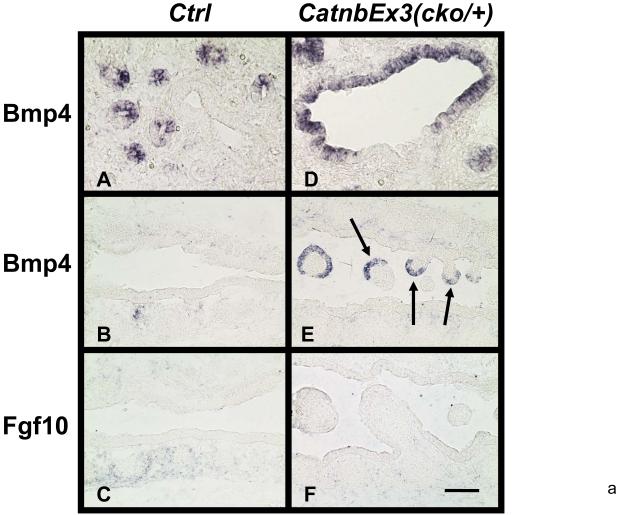
In situ hybridization for Bmp4 and Fgf10 mRNA in E15 control (A to C) and CatnbEx3(cko/+) (D to F) lungs and trachea. Bmp4 was nearly undetectable in control trachea (B). Arrows in panel E indicate induction of high Bmp4 levels in polyp epithelial cells in mutant trachea. Scale bar: 40 um (A, D); 80 um (B, C, E, F).
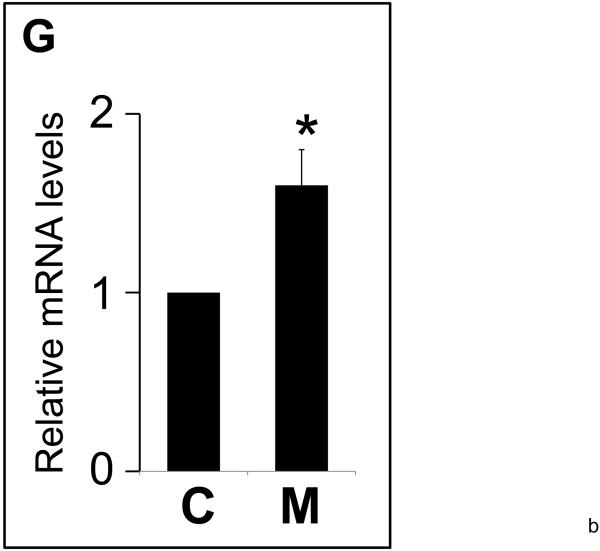
Panel G. Relative mRNA levels of Bmp4 in mutant (M) vs. control lungs (C) by quantitative RT-PCR. Levels of mRNA were normalized to that of TATA Binding Protein (TBP). * indicates P<0.05.


