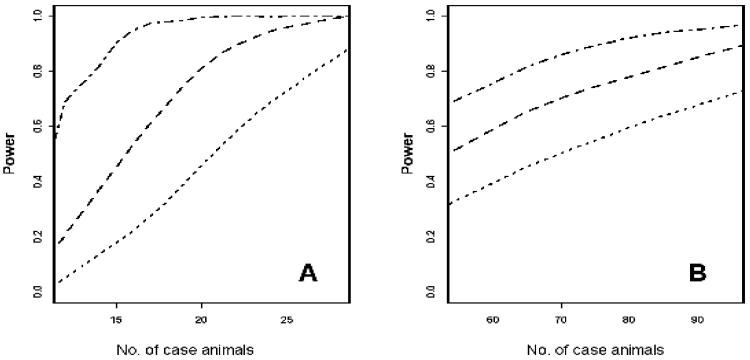
Figure 2.
Graphs of power analysis as a function of sample size for the detection of disease loci for a Mendelian recessive trait (A) or a multigenic trait (B). The analyses were conducted for r2 values of 0.5 (dotted lines), 0.65 (dashed lines) and 0.8 (dotted and dashed lines); the r2 value is a measure of LD. For each analysis, the number of case and control animals was equal.

