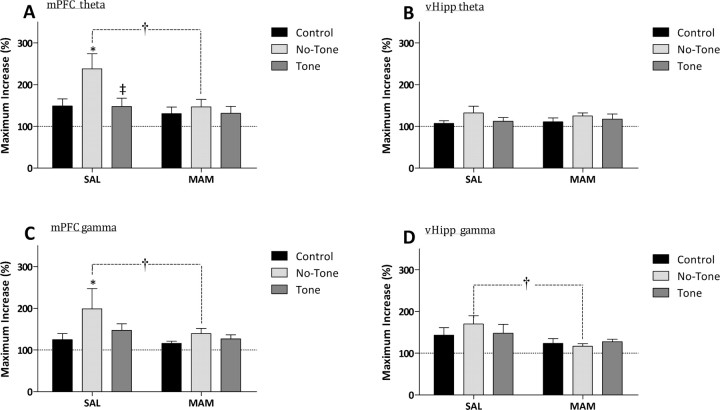
Figure 11.
MAM-treated rats display a significantly attenuated oscillatory activity during latent inhibition training and testing. Analysis of the maximum increase in oscillatory activity demonstrates significant deficits in the induction of mPFC theta (A) (4–12 Hz), mPFC gamma (C) (30–55 Hz), vHipp gamma (D) (30–55 Hz), but not vHipp theta (B) (4–12 Hz) between saline and MAM-treated rats. *Significant difference compared with no tone trials; ‡significant difference between tone (dark gray bar) and no tone (light gray bar) pre-exposure; †significant difference between saline and MAM-treated rats (p < 0.05, two-way ANOVA with Holm–Sidak post hoc: n = 3–5 rats/group).

