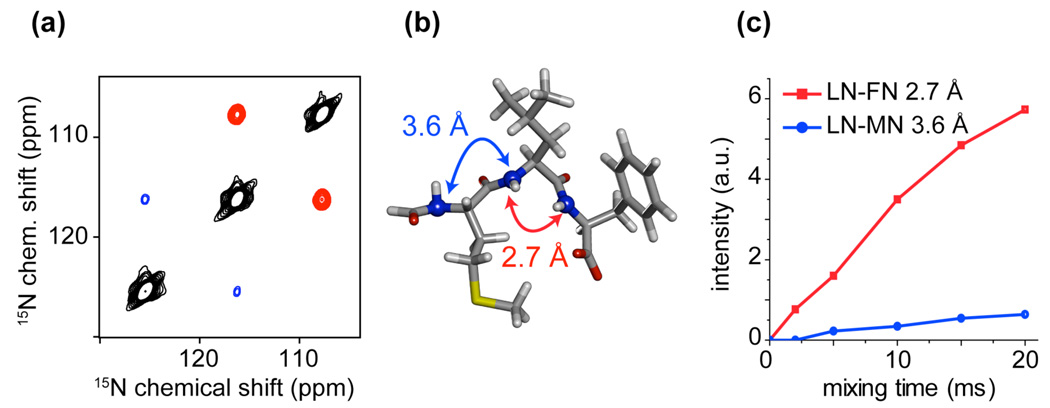
Figure 4.
(a) Low power 2D 15N-15N PAR correlation spectrum obtained on [U-13C,15N]-f-MLF-OH72 at ωr/2π = 20 kHz and ω0H/2π = 900 MHz using 20 ms of mixing time. The red cross-peaks correspond to a short LN-FN sequential contact (rNN = 2.7 Å, ~10 % efficiency at 20 ms) and the blue cross-peaks correspond to the long sequential LN-MN contact (rNN = 3.6 Å, ~5% efficiency at 20 ms) (see graphics (b)). (c) Cross-peak intensity build-ups in [U-13C,15N]-N-f-MLF-OH as a function of 15N-15N PAR mixing time. The PAR mixing consisted of ~ 4 kHz 15N and ~ 53 kHz 1H C.W. irradiations for both (a) and (c).

