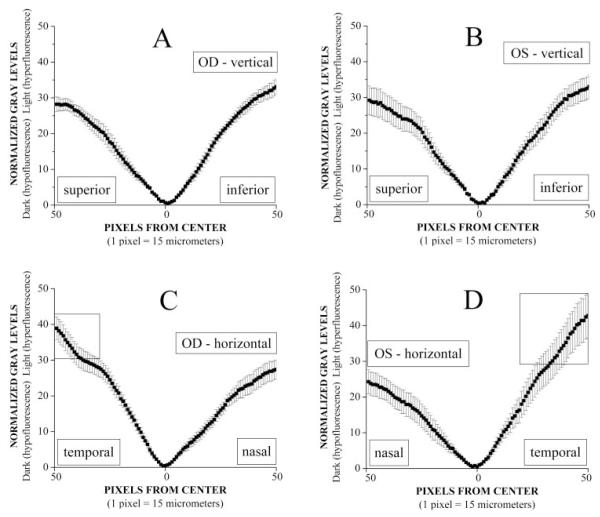
Figure 5.
Average data (mean ± SE) from normalized horizontal and vertical line scans from right and left foveas of 10 normal subjects. Each scan was normalized by division with respect to the lowest GL near the anatomic center of the fovea. Zero (0) on the x-axis represents the location of this most hypofluorescent pixel. The horizontal scale represents single pixel steps (15 μm/pixel). The vertical scale in each graph is the dimensionless GL ratio. (A, B) The vertical distribution of the GL ratios. The ratios superiorly are not significantly different from those inferiorly. (C, D) The horizontal distribution of the GL ratios. In the right eyes, the GL ratios for the 9 pixels (135 μm) from the temporal edge (enclosed in a box) are significantly higher than the highest GL ratios at the nasal edge of the fovea. In the left eyes, the GL ratios for the 14 pixels (210 μm) from the temporal edge (enclosed in a box) are significantly higher than the highest GL ratios nasally.

