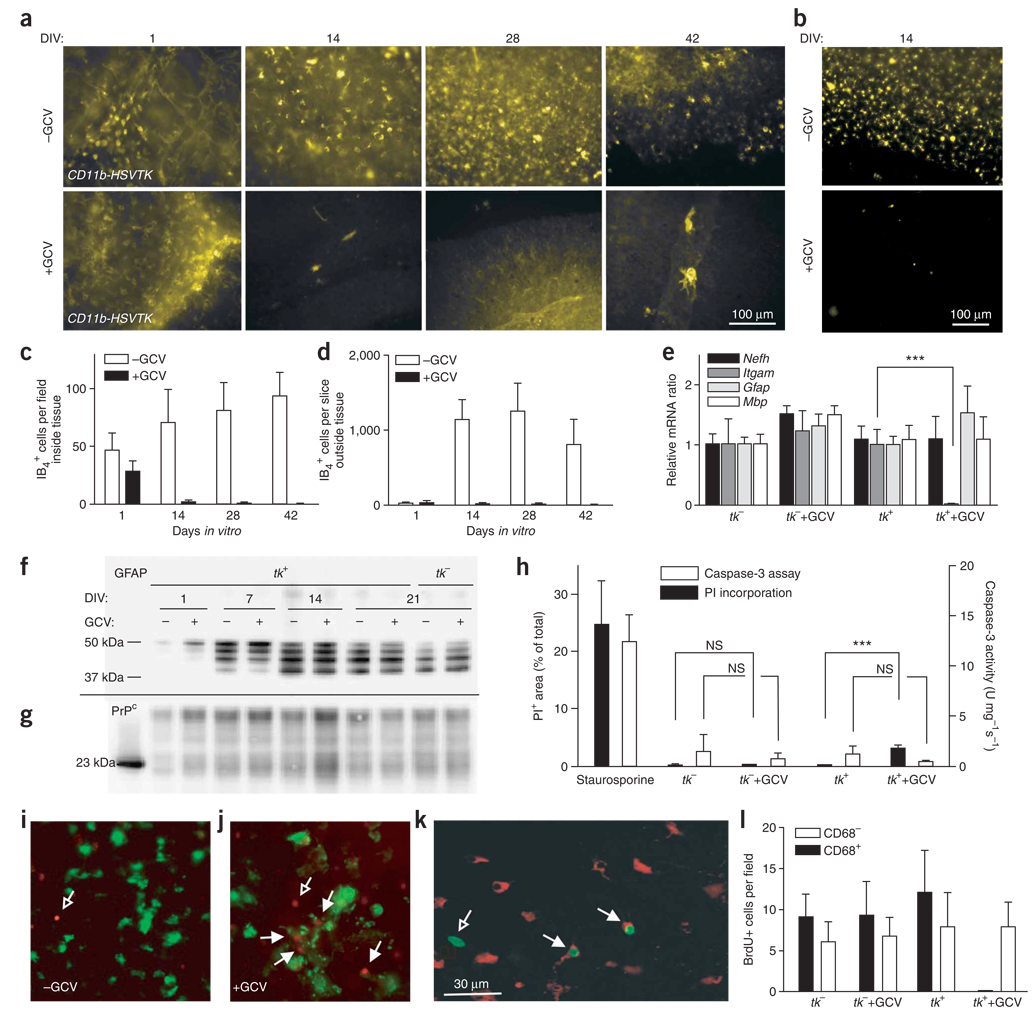
Figure 4.
Microglial depletion in organotypic slice cultures. (a,b) Slices from 10-d-old CD11b-HSVTK+ mice cultured for 1, 14, 28 or 42 d (DIV) in the optional presence of GCV and stained with IB4 (a) or anti-CD68 (b). (c,d) Quantification of cells resident within (c) or outside (d) of slices. (e) Real-time RT-PCR of CD11b-HSVTK+ (tk+) and CD11b-HSVTK− (tk−) slices cultured for 14 d in presence or absence of GCV (n = 3). mRNAs encoding neurofilament (Nefh), CD11b (Itgam), GFAP (Gfap) and MBP (Mbp) are shown. (f,g) Western blotting from cultures prepared from 10-d-old tk+ and tk− mice cultured with or without GCV, performed on 10 µg protein and detected with mouse IgG1 anti-GFAP (clone GA5) (f) or mouse IgG1 anti-PrPC (POM1) (g). (h) PI incorporation in cultures prepared as in e and treated with GCV for 5 weeks (n = 12). Positive control: tk− tissue treated with 5 µM staurosporine for 24 h. Caspase-3 enzymatic activity was measured and normalized to protein contents (n = 3 pools of four slices). (i,j) Tk+ slices untreated (i) or treated (j) with GCV for 10 d and then incubated while still alive with IB4 (green) and PI (red). Open arrows, IB4−PI+ cells; closed arrows, IB4+PI+ cells. Scale bar in k applies to i,j as well. (k,l) BrdU incorporation in samples prepared as in e after 13 dpi. (k) Example of stained cells. Green, IgG1 anti-BrdU; red, IgG2a anti-CD68. Closed arrows, CD68+BrdU+ cells; open arrows, BrdU+CD68− cells. (l) Counts of CD68+BrdU+ and CD68−BrdU+ cells (n = 6, each the average of five individual ×40 images). Averages of n replicas ± s.d.

