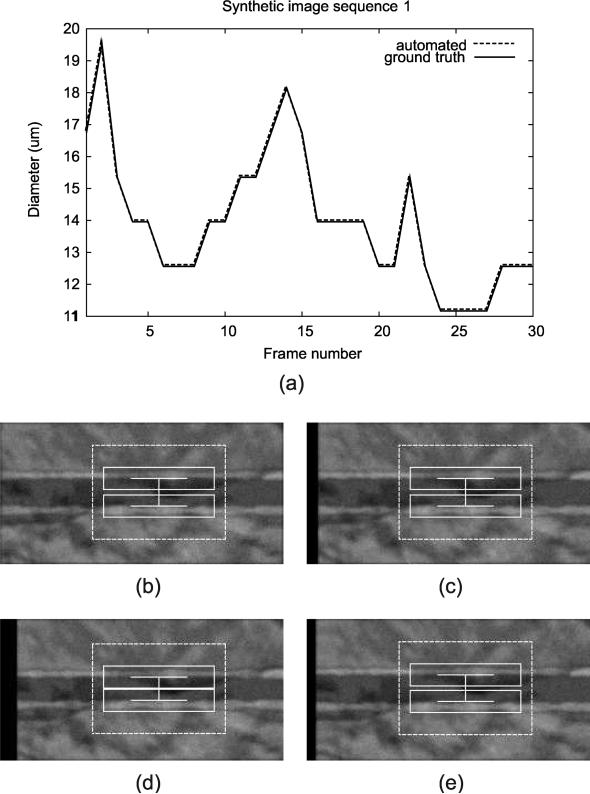
Figure 13.
Tracking result for a synthetic image sequence, showing (a) diameter measurement plot through the entire sequence along with the screenshots at different frames: (b) Frame 1, (c) Frame 10, (d) Frame 25, and (e) Frame 30. Note that the automated measurements lie exactly on top of the ground truth.

