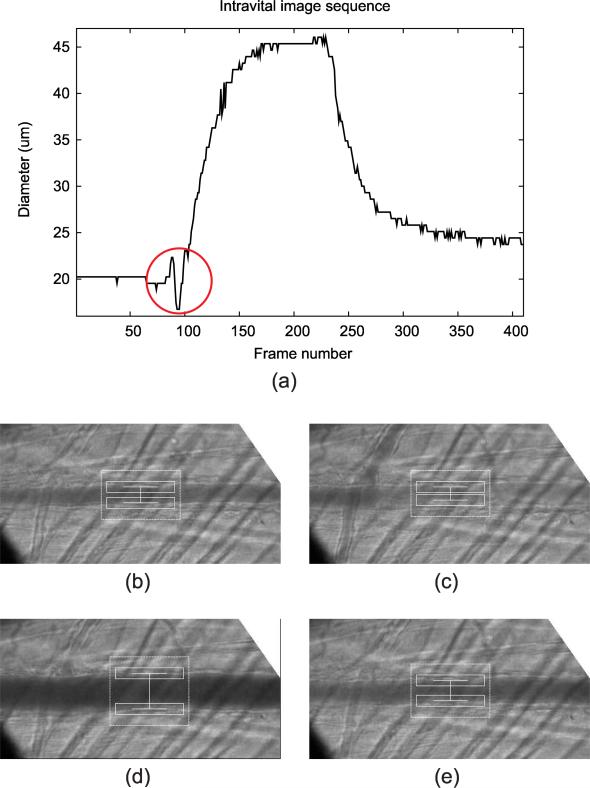
Figure 16.
Tracking result for the case that received the qualitative evaluation score of 3, showing (a) diameter measurement plot through the entire sequence along with the screenshots at different frames: (b) Frame 1, (c) Frame 95, (d) Frame 200, and (e) Frame 300. The correct tracking interfered as the lumen intensity brightens around frame 95. The erroneous measurement is marked with a circle in (a).

