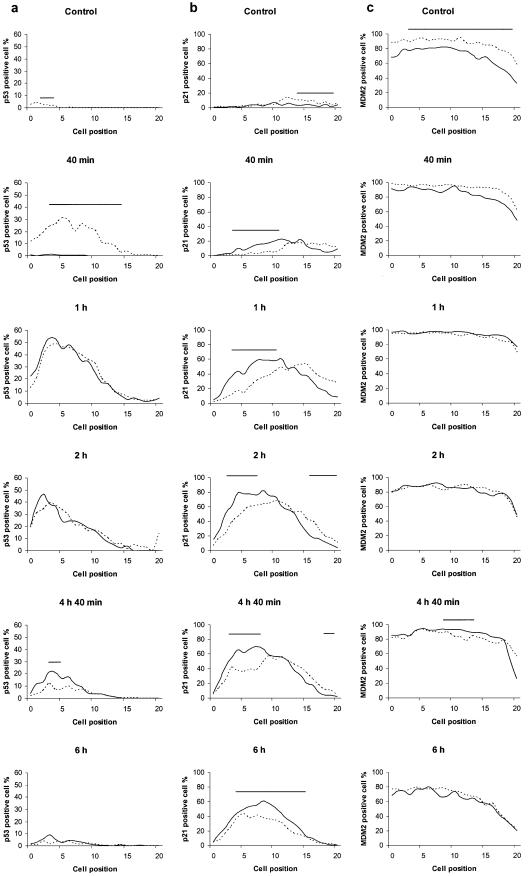
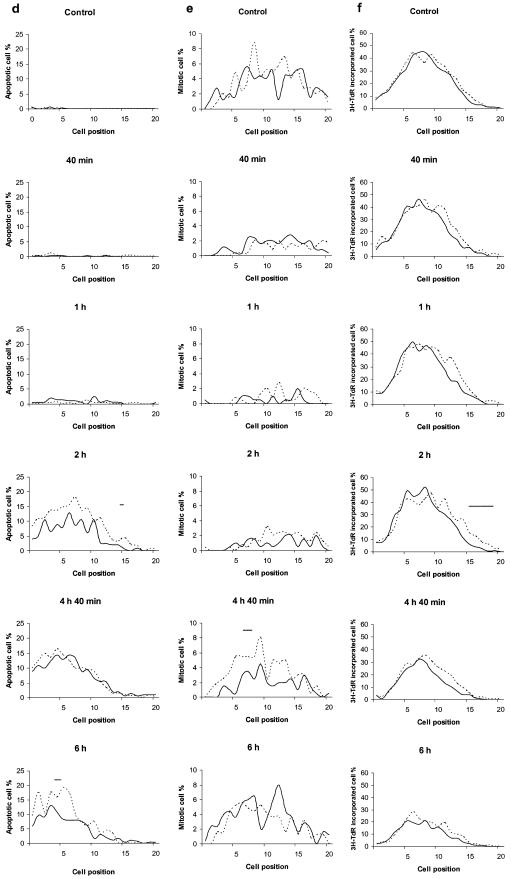
Figure 1.
Profiles of p53, p21 and MDM2 expression and of the fractions of apoptotic, mitotic and [3H]TdR-incorporating cells in small intestinal crypts of PARP-1–/– (continuous curves) and wt (dashed curves) mice following 1 Gy γ-irradiation. Cell positions are counted from the base of the crypt. The stem cells are concentrated at cell position 4–5. Each measure was determined as the average value for 50 half crypts taken from groups of at least four animals. Irradiated groups of mice were sacrificed at 40 min, 1 h, 2 h, 4 h 40 min and 6 h post-irradiation. (a) p53 positive cells; (b) p21 positive cells; (c) MDM2 positive cells; (d) apoptotic cells; (e) mitotic cells; (f) cells positive for [3H]TdR-incorporation. The range of cell positions where a statistically significant difference (P < 0.05) was found between PARP-1–/– and wt mice is indicated by a horizontal bar.


