
Figure 10.
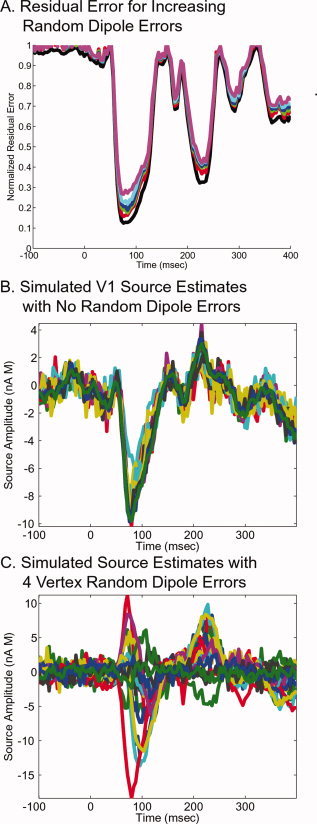
Sensitivity of estimated source waveform to typical errors in modeled dipole orientations with independence between stimulus locations. (A) Residual error of simulated source estimates with varying levels of average random dipole orientation errors (0, 18°, 30°, 37°, 41°, and 44°), corresponding to 0–5 vertex distance away from “true” dipole location. (B) Simulated V1 source estimates with no dipole errors. (C) Simulated V1 source estimates with 41° dipole errors, corresponding to ∼4 vertex displacement from “true” location. [Color figure can be viewed in the online issue, which is available at www.interscience.wiley.com.]