
Figure 3.
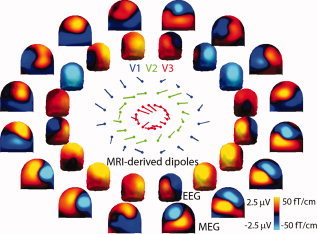
MEG and EEG contour plots arranged at polar angles corresponding to 16 iso‐eccentricity stimulus locations. MEG data (average amplitudes over 80‐ to 90‐ms post‐stimulus, gradiometers only) are interpolated onto the helmet surface (outer ring of contour plots) with red representing flux out of the head and blue representing flux into the head. EEG data is interpolated onto the outer scalp surface, with red representing positive scalp potentials and blue representing negative scalp potentials. Dipoles for V1, V2, and V3 (derived from structural and functional MRI data) are represented as ball and stick diagrams with the direction and length of the line indicating the dipole orientation components in the coronal plane. Data are from Subject 1. [Color figure can be viewed in the online issue, which is available at www.interscience.wiley.com.]