
Figure 5.
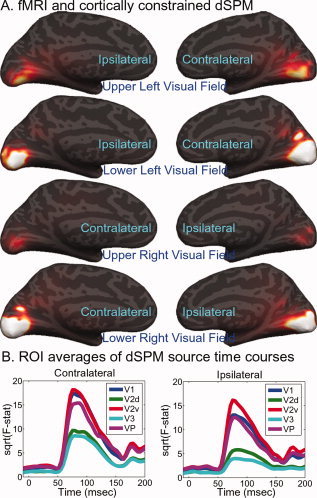
Cortically constrained, fMRI‐biased, noise‐normalized, L 2 minimum‐norm source estimates of visual evoked responses. (A) Medial, inflated views of cortical surface overlaid with dSPM statistics (see Methods) for visual responses evoked by stimuli in upper and lower, right and left quarterfields (eccentricity = 5°, polar angles = 56° 124°, 236°, 304°). (B) ROI average time courses for V1, V2, and V3 derived from dSPM. Source estimate statistics were averaged within hand‐drawn cortical surface‐based regions of interest (based on fMRI retinotopy maps and calculated field sign; see Methods), and then collapsed across hemispheres and stimulus locations into averages for contralateral or ipsilateral stimuli. [Color figure can be viewed in the online issue, which is available at www.interscience.wiley.com.]