
Figure 7.
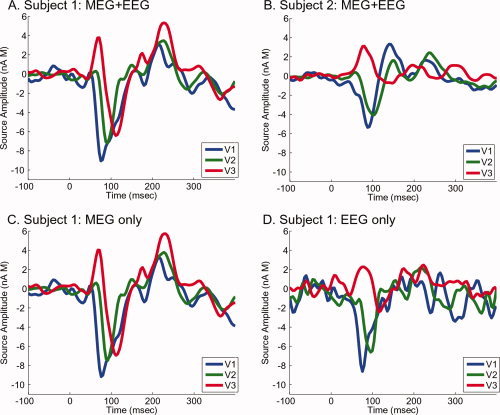
Retinotopy‐constrained source estimates assuming equality of source amplitudes across 16 stimulus locations. (A) Source estimates for Subject 1 generated for each visual area, constrained by the MEG and EEG data from the multiple stimulus locations. (B) Source estimates generated from Subject 2's MEG and EEG data (with dipoles modeled from Subject 2's MRI data). (C) Source estimates for Subject 1 using only MEG data. (D) Using only EEG data. [Color figure can be viewed in the online issue, which is available at www.interscience.wiley.com.]