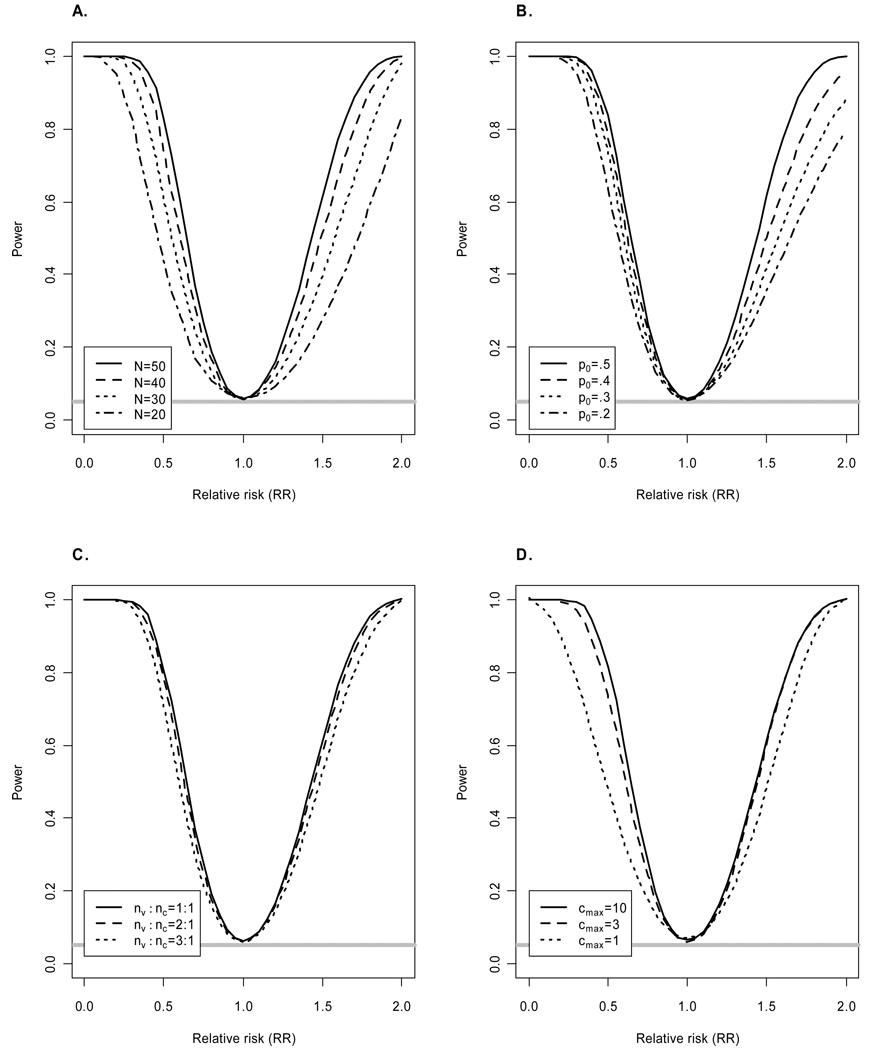
Figure 1.
Power of logrank test as a function of relative risk (RR). Unless indicated otherwise, simulations assumed equal numbers of animals allocated to the vaccine (nv) and control (nc) arms, total sample size N = 50, maximum of cmax = 10 challenges per animal, per-challenge probability of infection for controls p0 =0.5, and all animals susceptible to infection. The horizontal gray line corresponds to the significance level α=0.05. Power of likelihood ratio test and Fisher’s exact test is similar (results not shown).

