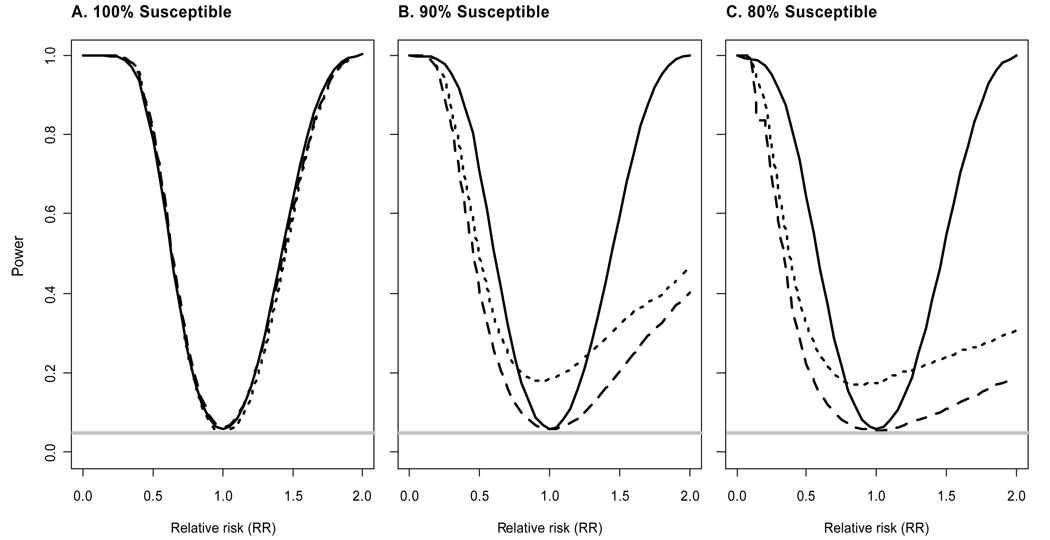
Figure 2.
Power of likelihood ratio, logrank, and Fisher’s exact tests as a function of relative risk (RR) for different fractions of susceptible animals. Solid lines correspond to the likelihood ratio test, long dashes to the logrank test, and short dashes to Fisher’s exact test. Simulations assume equal allocation to the vaccine and control arms, total sample size N = 50, maximum of cmax = 10 challenges per animal, and per-challenge probability of infection for controls p0 =0.5. The horizontal gray line corresponds to the significance level α=0.05.

