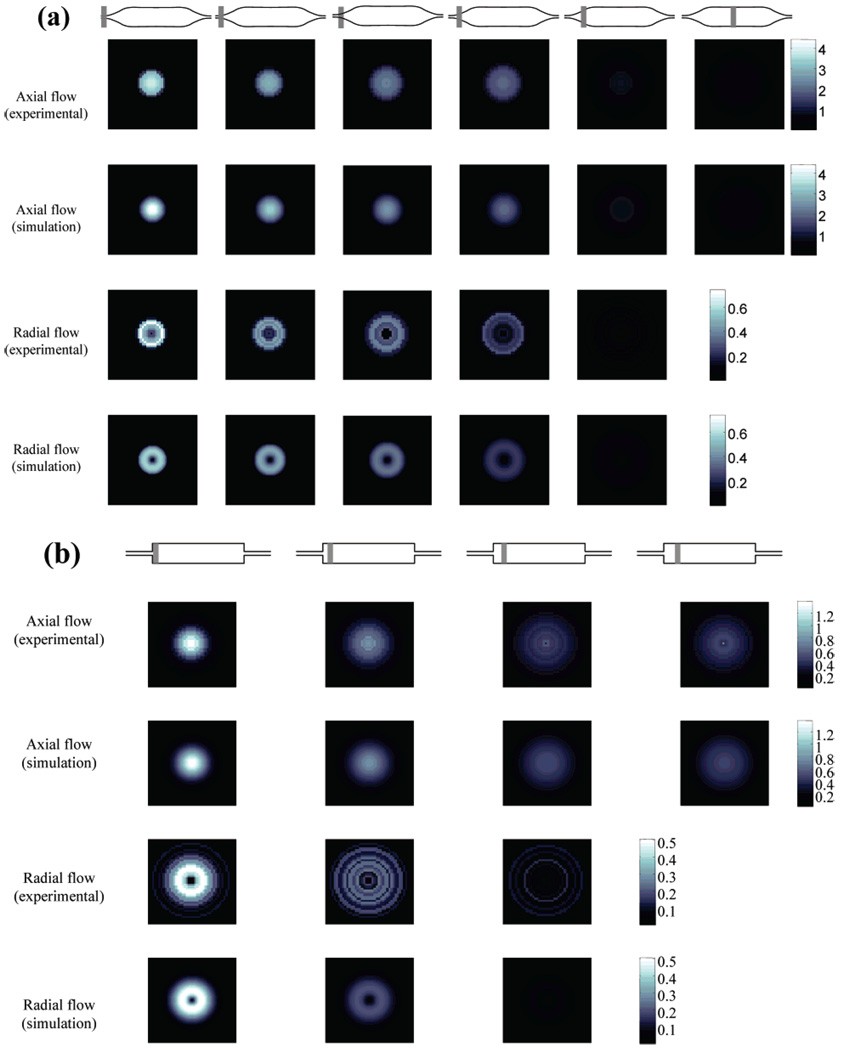
Figure 3.
Comparison of measured and simulated velocity fields of the two flow cells. (a) shows 2D velocity maps in the gradual flow cell and (b) maps in the abrupt flow cell. In (a), each column from the left to the right are slices centered at 100, 200, 300, 400, 600, and 2000 microns from the reference position shown in Figure 1a, as indicated by the gray bars. In (b), columns from the left to the right are slices centered at 100, 200, 300, and 500 microns from the reference position shown in Figure 1b.

