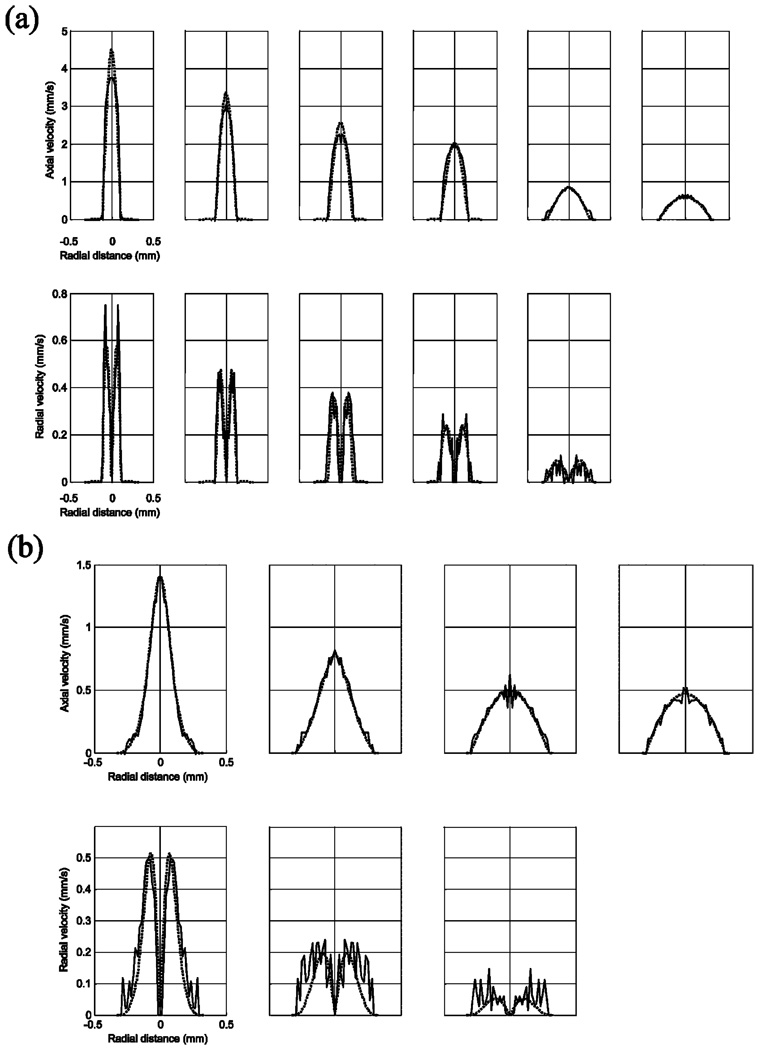
Figure 4.
Cross-sectional magnitude plots of the measured and the simulated velocity fields of (a) the gradual and (b) the abrupt flow cell for the data shown in Figure 3. The thin lines are experimental data, and the thick lines are simulated. No data are shown for the case where the radial velocity map was below the noise level.

