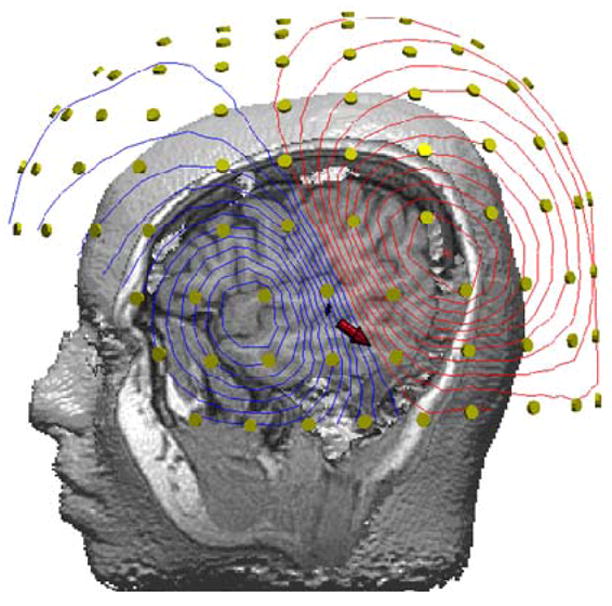
Figure 2.

Contour map of the surface distribution of magnetic flux by an auditory evoked stimulus. The red arrow indicates the location and direction of the equivalent current dipole (ECD), in the half-space between the inward (blue lines) and outward (red) flowing magnetic fields relative to the multiple MEG sensors that encircle the whole head (yellow circles).
