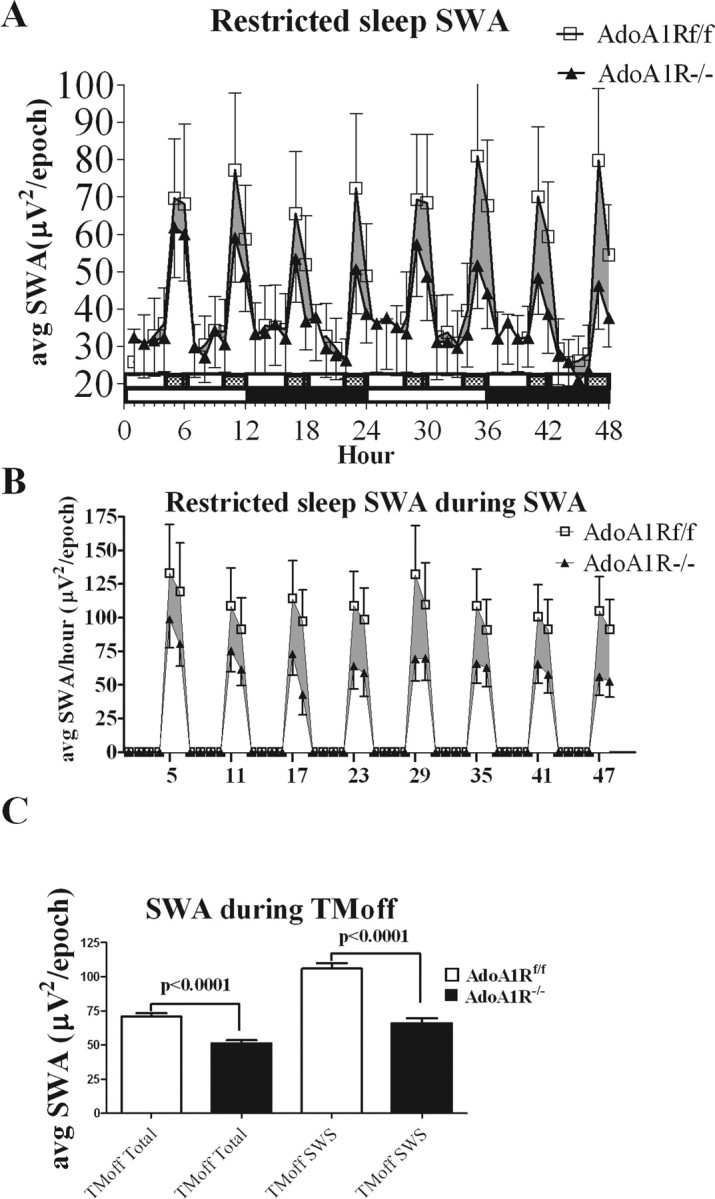
Figure 6.

SWA during chronic sleep restriction. The enhancement of synchronized SWA after each 4 h enforced-waking period is markedly attenuated in AdoA1R−/− mice compared with the AdoA1Rf/f littermates. A, A graph is shown of the SWA power/10 s epoch (y-axis) averaged over each hour of the 48 h spent of the treadmill (x-axis) from data pooled from AdoA1R−/− (▴; n = 5) and AdoA1Rf/f (□; n = 5) mice. The slow-moving treadmill was on for 4 h (indicated by open 4 h horizontal bar) and off for 2 h (filled 2 h bar) for repeating 6 h cycles. Mice were maintained on a 12 h light (open 12 h horizontal bar)/12 h dark (filled 12 h bar) schedule. Eight cycles were completed in the 48 h experiment, and during the 2 h treadmill-off phase, the SWA enhancement by the AdoA1R−/− mice was consistently attenuated (shaded region indicates the power difference) compared with the AdoA1Rf/f genotype. B, Mice were scored for behavioral state, and average SWA power only during SWS was plotted for each of the 48 h of the experiment on the treadmill. C, The averaged SWA power/epoch for all of the treadmill-off phases showed a significant difference between genotypes, indicating a reduced SWA response to the 4 h waking period (left two bars). The largest difference in SWA power was observed during SWS during the TM off phase (right two bars). Error bars indicate SEM.
