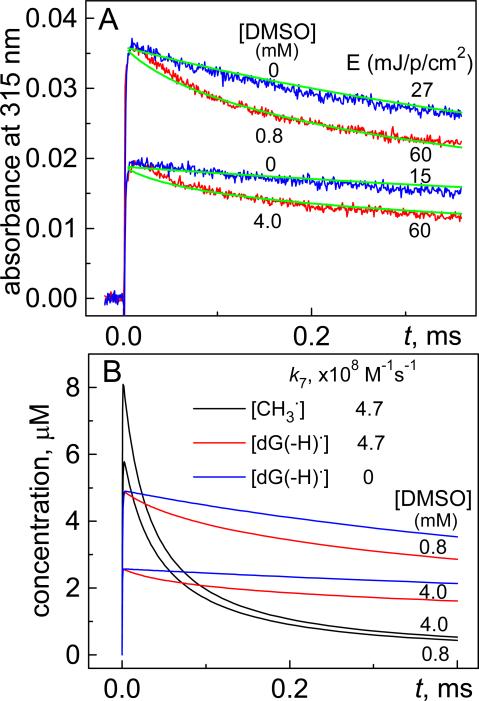
Figure 2.
(A) Transient absorption profiles of dG(-H)• radical decay at 315 nm in the presence (red traces) and absence (blue traces) of DMSO after a single 308 nm laser pulse excitation of a deoxygenated buffer solution (pH 7.5) containing 0.2 mM dG and 30 mM Na2S2O8. (B) Kinetics of dG(-H)• radical decay (red traces) and •CH3 radicals (black traces) simulated by means of the INTKIN program using the reaction rate constants 3 – 9 shown in Table 1 based on an initial, laser pulse-induced SO4•− concentration of 11 μM. The blue traces show the decay of dG(-H)• radicals with the assumption that the rate constant k7 = 0. The transient absorption profiles of dG(-H)• radicals (green traces) were calculated from the simulated kinetic decay curves shown in Panel A.

