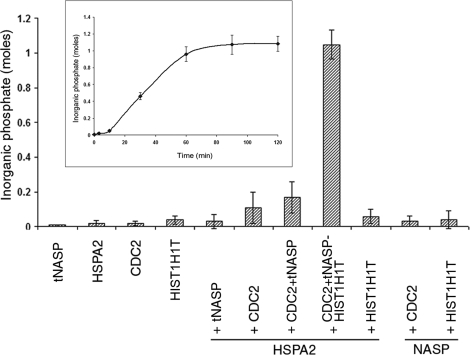
FIG. 6.
The HIST1H1T-tNASP-HSPA2-CDC2 complex shows ATPase activity. ATPase activity of HSPA2 is presented as moles of inorganic phosphate liberated by 1 mol of HSPA2 after 60 min of incubation at 37°C in the presence of the indicated proteins. Data are represented as mean ± SD. Inset shows kinetics of HSPA2-mediated ATP hydrolysis in the presence of tNASP, CDC2, and HIST1H1T. Graph presents the moles of inorganic phosphate liberated by 1 mol of HSPA2 during 120 min of incubation at 37°C. Reaction plateau occurs after 60 min of incubation at 37°C.

