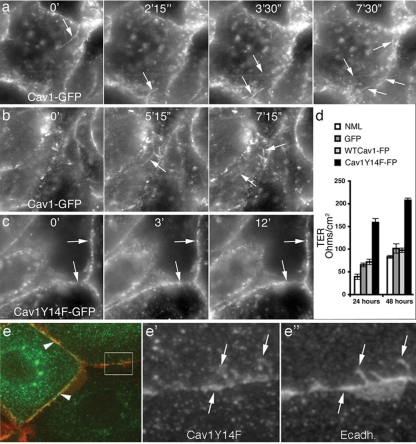
Figure 5.
Cells expressing the Cav1 tyrosine phospho-mutant Cav1Y14F exhibit reduced border dynamics as well as an increase in transepithelial electrical resistance. (a–c) Select still fluorescence images from movies of HPAF-II cells stably expressing wt Cav1-GFP (a and b) or the Cav1 tyrosine phospho-mutant Cav1Y14F-GFP (c). Imaging was initiated approximately 5 min after the addition of EGF (30 ng/ml); time frames (minutes and seconds) are indicated at the top of each image. Cells expressing wt Cav1-GFP exhibit very dynamic borders from which many Cav1-coated vesicles and tubules are liberated (a and b; arrows). In contrast, cells expressing Cav1Y14F-GFP display static, linear borders (c; arrows) that exhibit little membrane dynamics. (d) Graph depicting the transepithelial electrical resistance (TER) of normal, untransfected (NML) MDCK cells, control MDCK cells stably expressing GFP, MDCK cells stably expressing GFP-tagged wt Cav1 (WTCav1-FP), and MDCK cells stably expressing mRFP-tagged Cav1Y14F (Cav1Y14F-FP). Measurements were taken 24 and 48 h after cells had reached confluency. Cells expressing Cav1Y14F-mRFP showed a two- to threefold increase in TER, compared with untransfected MDCK cells or cells stably expressing GFP alone or GFP-tagged wt Cav1 (n = 3; results represent the average ± SD). (e–e″) To look for colocalization of E-cad in Cav1-coated membrane invaginations, cells expressing wt or mutant Cav1Y14F were fixed and stained for both proteins. Cav1-positive punctate protrusions of the cell membrane were observed to be markedly positive for E-cad, particularly in cells expressing the mutant Cav1Y14F protein. Scale bars, 10 μm.

