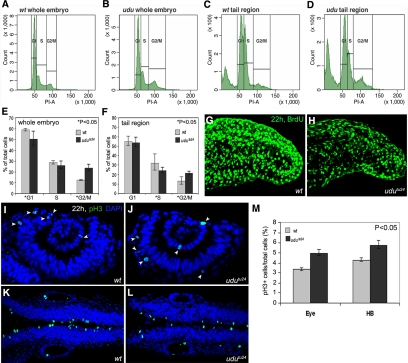
Figure 3.
Loss of udu function results in aberrant cell cycle. (A–D) Representative traces from FACS analyses after PI staining of dissociated cells at 22 hpf from wild-type and udutu24 embryos. (A and B) Dissociated cells from whole wild-type and udutu24 embryos. (C and D) Dissociated cells from wild-type and udutu24 embryos' tail region posterior to yolk extension. (E and F) Histograms summarize experimental data from FACS analyses after PI staining of dissociated cells from (E) whole embryos and (F) tail region posterior to yolk extension. The histograms are depicted as average ± SD format from triplicate experiments. udutu24 embryos contain fewer cells in the G1 and S phases and have an accumulation of cells in the G2/M phase (asterisks marked those p <0.05, Student's t test; p value for whole embryo: *G1, p = 0.041; S, p = 0.151; *G2/M, p = 0.007; for tail region: G1, p = 0.05; *S, p = 0.035; *G2/M, p = 0.016). (G and H) Projection of the lateral stacks of S phase cells labeled with BrdU at 22 hpf. Images are tail region posterior to yolk extension shown in lateral view with anterior to the left. (I–L) Wild-type and udutu24 embryos stained with pH3 antibody (green, arrowheads); nuclei are counterstained with DAPI (blue): eye region (I and J) and hindbrain region (K and L). (M) Percentage of pH3-positive cells in eye and hindbrain regions are obtained by counting pH3-positive cells versus total cells labeled with DAPI and are summarized in histogram, expressing in average ± SD format from four wild-type and four udutu24 embryos (p < 0.05, Student's t test).

