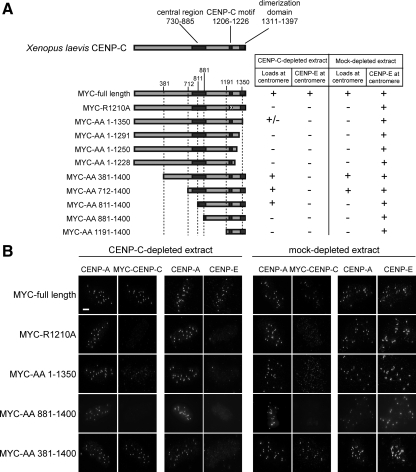
Figure 4.
Domain analysis of CENP-C. (A) The CENP-9193C truncations used in the experiment are diagrammed on the left. The regions spanning the central domain, CENP-C motif and cupin domain (from left to right) are shaded dark gray. The results of the extract complementation results for MYC-tagged CENP-C localization and CENP-E localization are indicated on the right. (B) Representative immunofluorescence images of complementation experiments showing CENP-A and MYC-CENP-C or CENP-E. Bar, 5 μm. See also Supplemental Figure S2.

