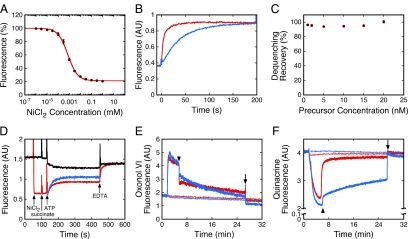
Figure 2.
Transport assay based on fluorescence dequenching of proOmpA-HisC-Atto565(Ni2+). (A) Quenching of proOmpA-HisC-Atto565 fluorescence by Ni2+. The proOmpA-HisC-Atto565 (30 nM) fluorescence was measured at various concentrations of NiCl2 in import buffer with 8 μM SecB. Data were fit with a single binding site model using Ftotal = (100 + Fbound[NiCl2]/KD)/(1 + [NiCl2]/KD), where Ftotal and Fbound are the observed (total) fluorescence and the fluorescence when Ni2+ was bound to all the 6xHis-tagged precursor molecules, respectively (KD = 0.7 ± 0.1 μM, n = 3). (B) Dequenching of proOmpA-HisC-Atto565(Ni2+) by EDTA. ProOmpA-HisC-Atto565 (7.5 nM) in import buffer with 8 μM SecB was preincubated with NiCl2 (5 μM), quenching the fluorescence as shown in A. Addition of EDTA (3 mM, blue; 5 mM, red) at time t = 0 resulted in dequenching with single exponential kinetics (fits not shown). The reaction order was ∼3–4 with respect to EDTA concentration (not shown). Thus, the dequenching rate is not linear with respect to EDTA concentration. (C) Percent fluorescence dequenching recovery at different proOmpA-HisC-Atto565 concentrations. Dequenching recovery was performed as in B using 10 mM EDTA (n = 3). (D) Fluorescence-based import assay. ProOmpA-HisC-Atto565 (10 nM) was incubated with IMVs (A280 = 1.0). NiCl2 (5 μM), succinate (5 mM), ATP (1 mM), and EDTA (10 mM) were added where indicated. Precursor import was initiated with ATP and was observed as fluorescence dequenching when Ni2+ was present (red), and fluorescence quenching when Ni2+ was absent (black). The true transport kinetics, FN→D (blue), was obtained by subtracting the ATP-induced kinetics without NiCl2 (FD→Q1, black) from that with NiCl2 (FN→Q2, red). (E and F) Δψ (E) and ΔpH (F) gradients produced under various conditions. The gradients produced by succinate alone (5 mM, thick red curves) exhibited a sudden decrease in magnitude when the solutions became anaerobic (arrowheads). The gradients produced by ATP (1 mM) + succinate (thick blue curves) also exhibited a sudden decrease in magnitude when the solutions became anaerobic, although the ΔpH decrease was significantly reduced. Both gradients fully collapsed when ionophores were added (5 μM valinomycin + 5 μM nigericin, arrows). No gradients were obtained if the ionophores were added at t = 0 min (thin curves).

