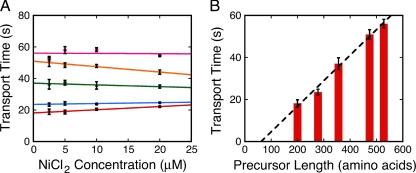
Figure 5.
Effects of different precursor lengths on transport time. (A) Transport time dependence on NiCl2 concentration for different precursor lengths. All precursors concentrations were 10 nM (n = 2 for each): red, 0.53XproOmpA-HisC; blue, 0.77XproOmpA-HisC; green, proOmpA-HisC; orange, 1.34XproOmpA-HisC; and pink, 1.51XproOmpA-HisC. [IMV] (A280) = 1. (B) Transport time dependence on precursor length. Total precursor length was plotted against the 0 μM NiCl2 transport time (τ), which was estimated by linear extrapolation from the data shown in A. The dashed line is a linear fit to the data, with an x-intercept of 61 amino acids.

