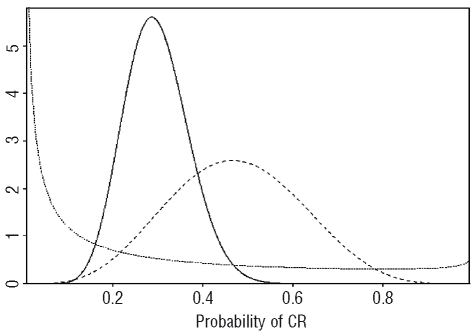
Figure 1.
Bayesian probability distributions using a trial of a new therapy in relapsed acute myeloid leukemia as an example. The values on the horizontal axis are different probabilities of complete remission. The values on the vertical axis represent the weight assigned to each CR probability. Prior to treatment, although the average CR rate is thought to be 20%, some credence is assigned to each probability of CR (prior probability distribution, dotted line). After observing 5/10 CRS (first posterior probability distribution, dashed line), the average CR rate is close to 50% and no credence is given to CR rates less than 10% or greater than 90%, reflecting the impact of the observed data on the prior. Thus, the posteriors become successively more informative as the data accumulate, and shift to reflect the overall average behavior of the data. After observing 7 CRs in the next 30 patients (total 12 CRs in 40 patients), the average CR rate is approximately 30% and no credence is given to a CR rate greater than 60% (2nd posterior probability distribution, solid line). Computing the proportion of the area under the curve that is to the right of a CR rate of 0.4 gives the current probability that the CR rate is greater than 0.4. This probability can be used to make treatment decisions.

