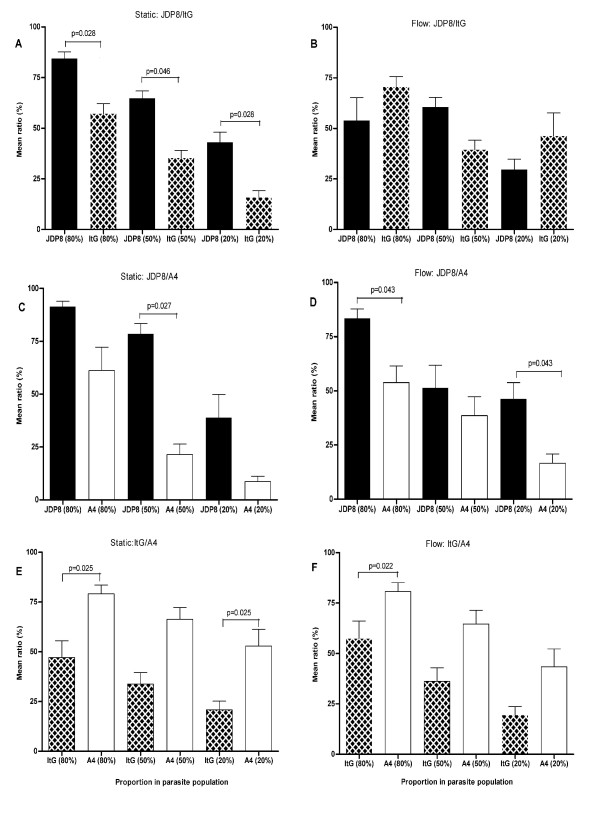
Figure 1.
Adhesion of JDP8, ItG and A4 to HUVEC under both static and flow conditions. Data is shown as mean ratio of binding for each pRBC pair ± standard error of the means of 2-3 experiments. Parasite lines are plotted adjacently by proportion in each experiment, rather than as paired in the adhesion assays, for ease of statistical interpretation. Differences between mean ratios of paired parasite lines were statistically significant if P < 0.05.

