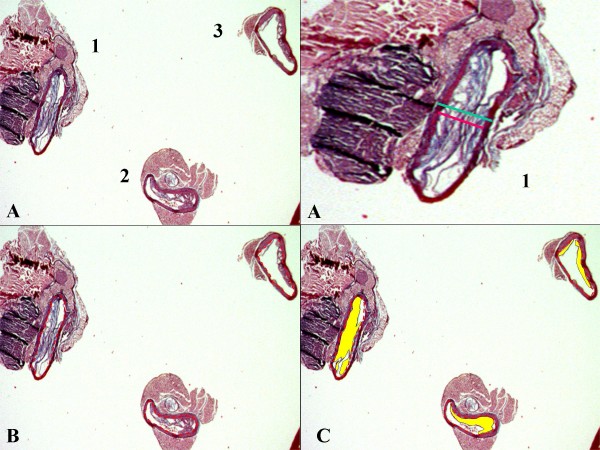
Figure 2.
An example of three aorta cross-sections, and how the measures were taken. Three sections and the close view of section n°.1 corresponds to the most severely obstructed segment, where measurement of plaque height (red line) and external diameter (green line) were performed (2A). The internal vessel perimeter measurement, represented by red dotted lines (2B) and the total plaque area, in yellow (2C).

