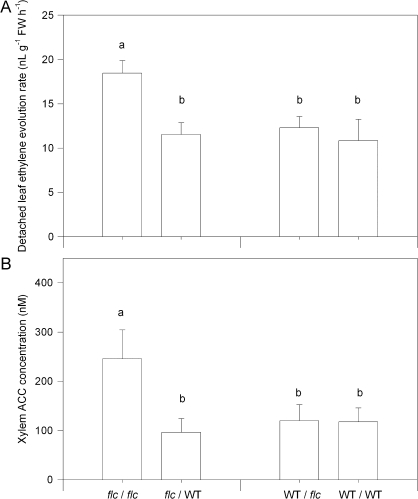
Fig. 6.
Detached leaf ethylene evolution (A) and leaf xylem ACC concentration (B) of unmisted WT/WT, WT/flc, flc/WT, and flc/flc plants. Data are means ±SE of 6–12 plants, with significant (P <0.05) differences between treatments according to Tukey's HSD test denoted by different letters above the bars. P values for two-way ANOVA are reported in Table 3.

