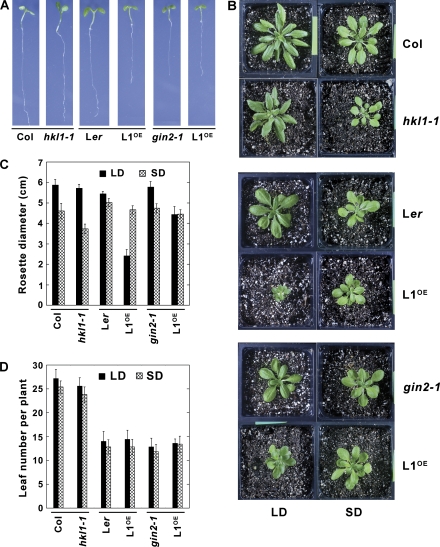
Fig. 2.
Growth phenotypes of HKL1 mutant and transgenic lines. Dark bars indicate corresponding parental controls and modified lines. (A) Seven-day-old seedlings on 1× MS plates+0.5% sucrose. (B) Plants grown 30 d in a growth chamber under 8 h (short day, SD) or 16 h (long day, LD) photoperiods. (C) Average rosette diameter (cm) after 30 d ±SD, n=10. The difference in average diameters of Col and hkl1-1 plants under SD conditions is statistically significant by a 2-tailed T test at P >0.95. (D) Average leaf number per plant at the time of bolting ±SD, n=10.

