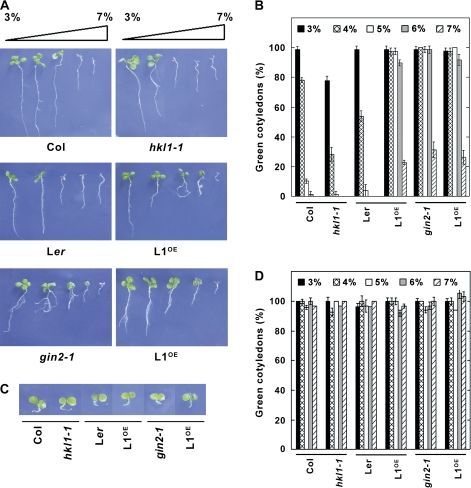
Fig. 6.
Phenotypes of HKL1 mutant and transgenic lines grown on agar plates with 3–7% glc. (A) Images are representative 7-d-old seedlings. (B) Percentage of seedlings in (A) at corresponding glc concentrations which had green cotyledons. Values are expressed relative to the total number of germinated seedlings (30–40), as means ±SD, n=3. (C) Images of representative 7-d-old seedlings grown on agar plates with 6% mannitol. (D) Percentage of seedlings in (C) at corresponding mannitol concentrations which had green cotyledons. Values are expressed relative to the total number of germinated seedlings, as means ±SD, n=3.

