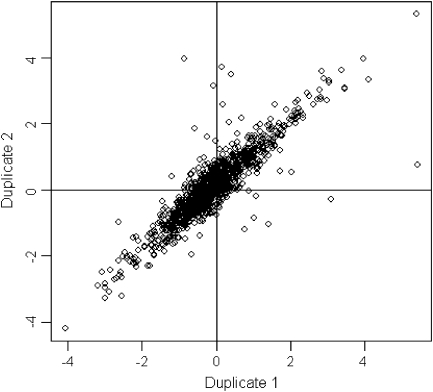
Fig. 1.
Consistency of log2 fold changes for duplicate spots. The plot compares log2 fold changes for the SAM versus a non-meristematic tissue comparison for the 1237 probes with duplicate spots. The first duplicate of each probe is on the x-axis and the second duplicate of the same probe is on the y-axis. Duplicates show a very high level of concordance.

