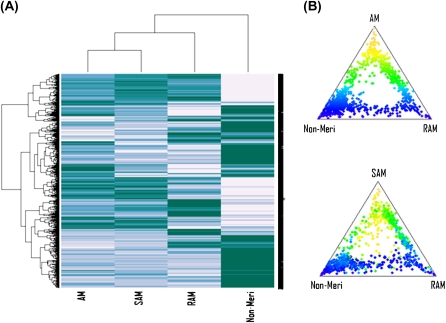
Fig. 4.
Expression profiles of the 1000 transcripts with the most variable expression across the four tissues used. (A) Hierarchical clustering and heatmap and (B) ternary plots of relative expression. The ternary plots position each transcript according to its relative expression in three different tissues. The distance of each point to each corner is inversely proportional to its expression level in that tissue. Points near each corner of the ternary plot correspond to transcripts expressed exclusively in that tissue whereas transcripts near the centre of the plot are expressed equally in all three tissues. Transcripts are colour-coded according to the first ternary plot, i.e. according to relative expression in AM versus RAM and non-meristem, and the same colour coding is used in the second plot. Both heatmap and ternary plots show strong consistency between AM and SAM.

